The challenge: a successful app with no rules for where things go
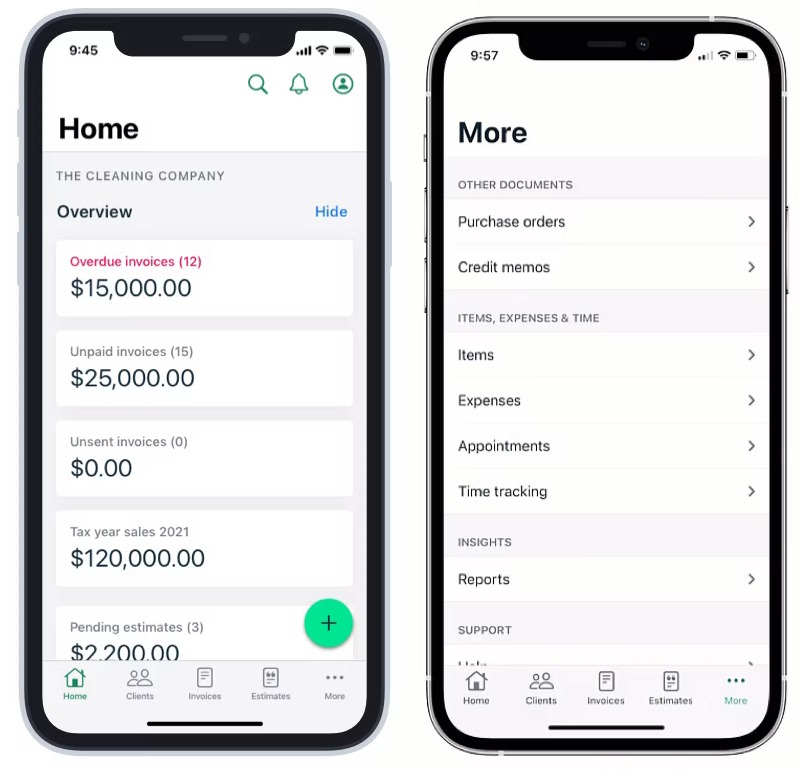
Invoice2go had become the number one invoicing app in the App Store, with over 220,000 customers. Years of added features without governance had left a messy information architecture. A hamburger menu buried features, and nothing set the hierarchy for primary actions.
Support tickets showed people didn’t know where to find settings or core functions, and analytics showed that secondary features went undiscovered, which limited the value of work we’d already built. There was also no framework for adding the next feature, so each one restarted the debate about where it should live.
I led the redesign end to end across iOS, Android and web, over six months, with the Senior Researcher, a Data Analyst, and partners in Engineering, Product and Customer Support.
The hypothesis was that a well-structured information architecture and navigation would make key features easier to find, for new and existing customers. The goals were a new IA that would last, an alternative to the mobile hamburger menu, mobile first with the web app aligned afterwards, and a decision framework for adding features. We would measure time to access, first-time use, organic retention and task completion.
The timing was awkward. Leadership wanted new revenue-driving features shipped, and I argued for fixing the foundation first. Disrupting existing customers was a real risk, but so was carrying on: weak feature adoption, a growing support load, and every new feature making the problem more expensive to fix.
The evidence said: no single structure would suit everyone
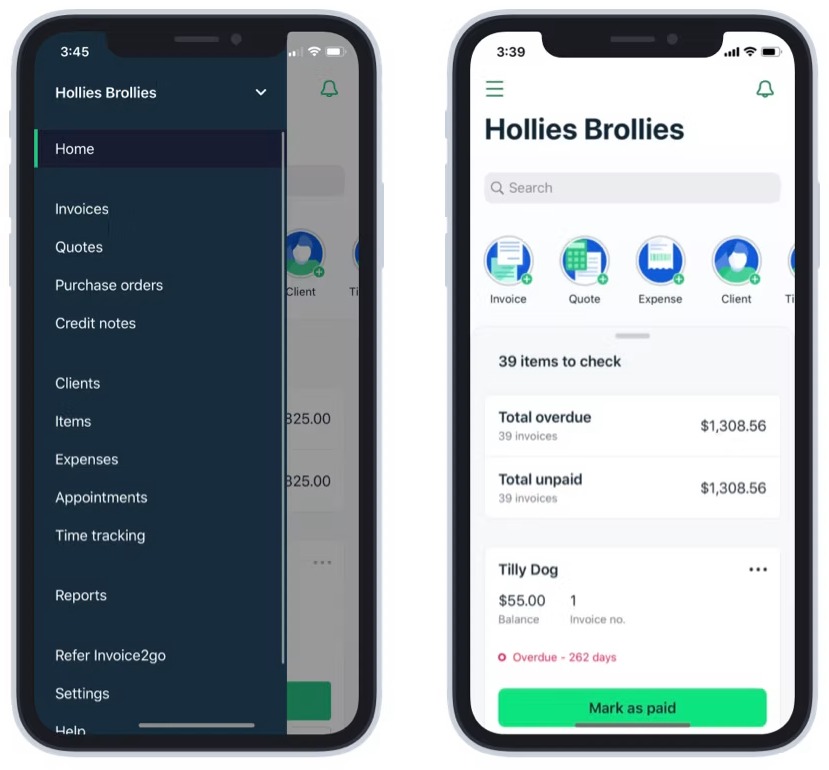
I started with what we already had. The Data Analyst and I looked at homepage engagement to see which features were used and which were ignored. I read Zendesk tickets and weekly reports for the questions people kept asking about navigation, and met the customer operations team to hear customer stories, which gave me both numbers and anecdotes. I also audited the settings pages, which mixed features, settings and profile content in ways that didn’t always make sense. People were struggling with basic tasks, and many features were adopted rarely simply because they were hard to find.
For a first draft of the new structure, I ran a card sort with colleagues at Invoice2go. It was one of several inputs, not the answer.
To test the draft against the current structure, I ran an A/B tree test on Optimal Workshop. We picked the ten most common user tasks and tested them with 30 non-customers, so existing habits wouldn’t bias the results. I ran it twice, using the first round to draft a second version. It showed:
- People had mixed mental models, so no one structure would satisfy everyone.
- My proposed structure had too many layers of navigation.
- Some settings were expected in context, not in one central place.
- Onboarding would matter to help people adapt.
That changed my aim. I stopped trying to design a perfect structure and chose the most common mental models, with fewer layers and some settings in context, then planned to help people through the change.
I built a model to decide where every feature lives
With the Senior Researcher, I created a bucketing model suited to how Invoice2go is structured. A company can have many users, and a user can have many companies, so content had to be split between the company level (invoices, customers, reports) and the user level (personal settings, notifications, account information).
I started by working out how the product itself worked, then mapped what belonged to the company and what was personal to the user. That split became the guide for placing every feature and setting. It also gave the team something it had never had: a way to answer “where does this go?” without another debate.
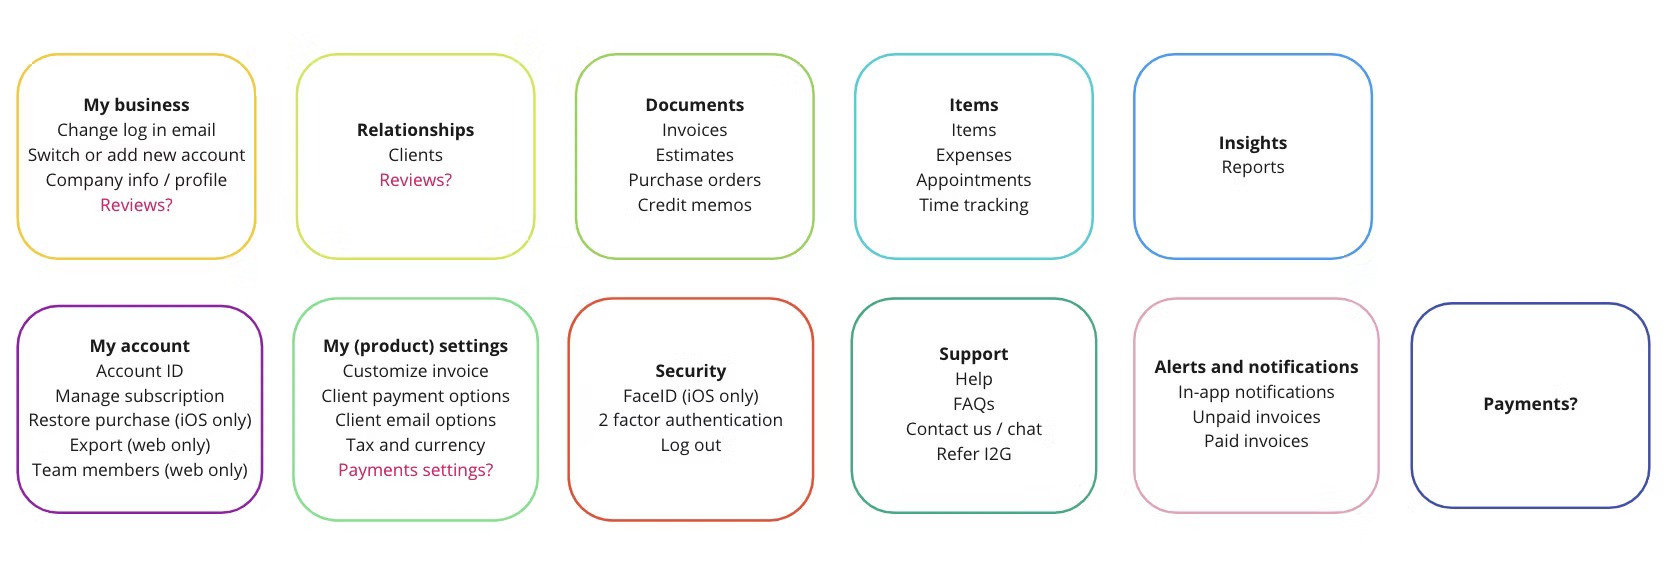
I then ran an unmoderated usability study on the third iteration, comparing the hamburger menu against a tab bar. Twenty small business owners who weren’t Invoice2go customers each did five tasks on a low-fidelity Axure prototype. People completed core tasks using the tab bar, found a profile icon more intuitive than a settings cog for their account, and looked in the Account area for settings.
To keep the model from drifting, I wrote a self-service Confluence guide so teams adding a feature or setting could see where it belonged in the new structure.
Four decisions, each with a cost
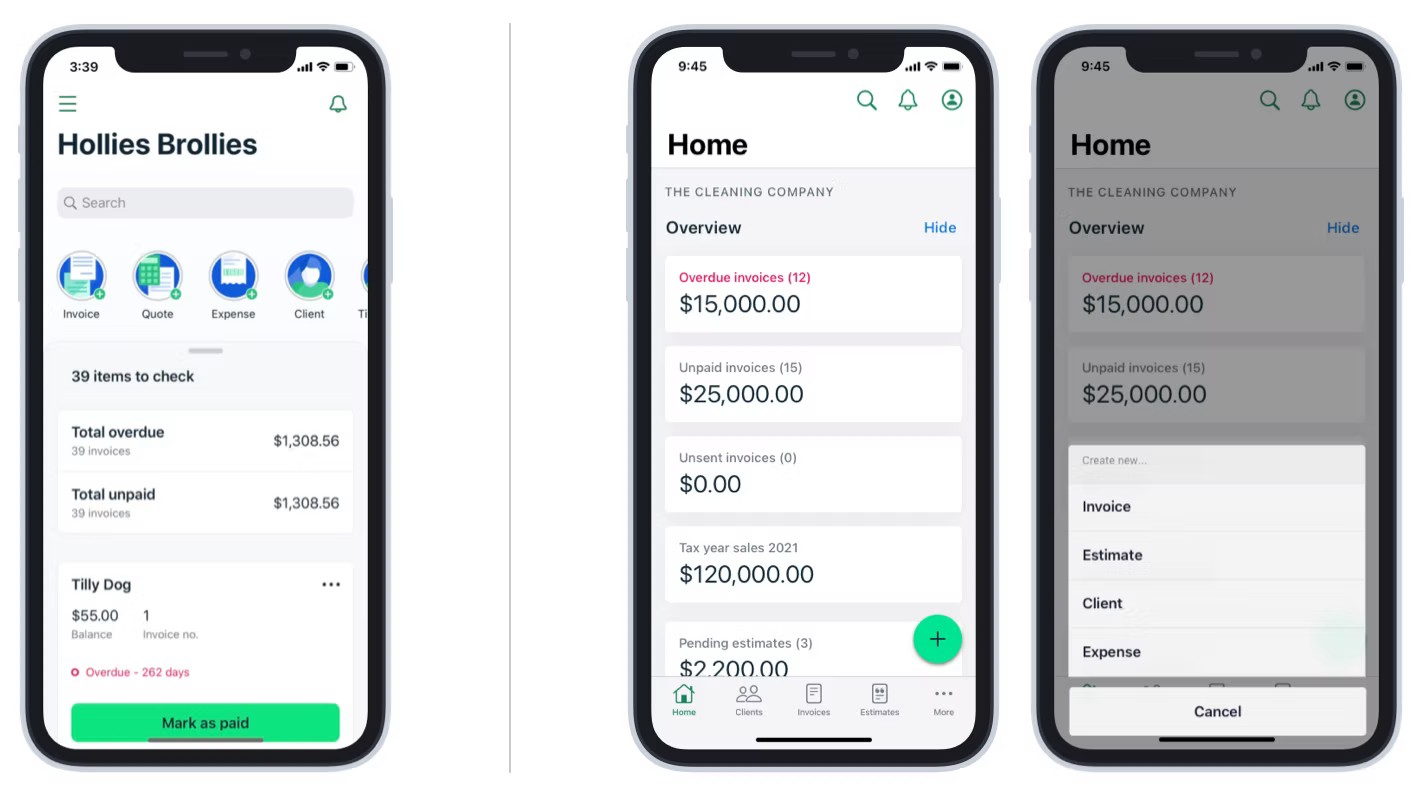
A tab bar instead of the hamburger menu. I replaced the menu with a bottom tab bar on Android and a tab bar on iOS, so primary features were always visible and nobody had to remember what was hidden. It was a big departure for people who had learned the old pattern, and research said it would improve discoverability enough to be worth the disruption.
A floating action button. Quick actions had been a horizontal scroll, which was clumsy and couldn’t take more items. A floating action button put the key actions in one place, with room for new ones, and freed up space on the home screen for more important content.
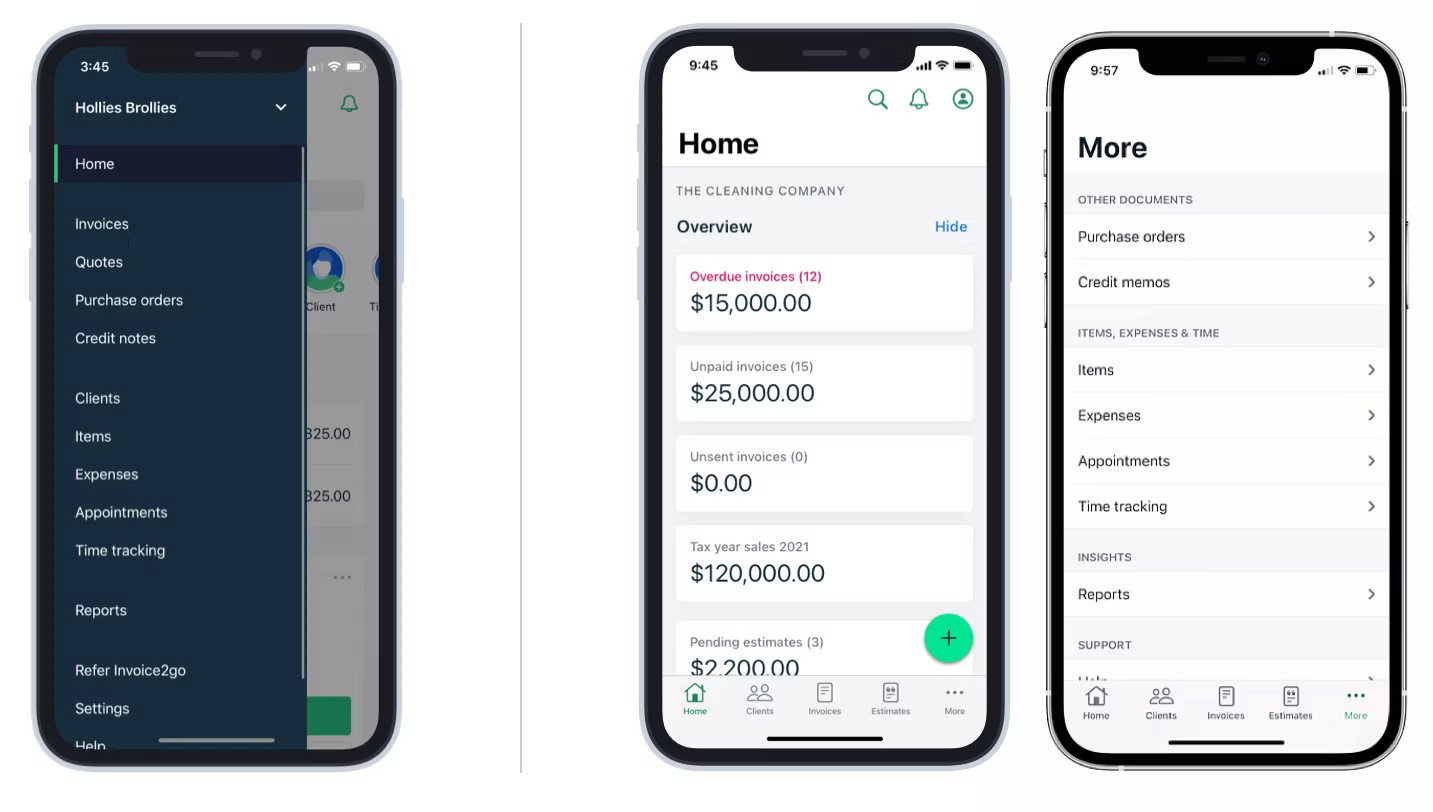
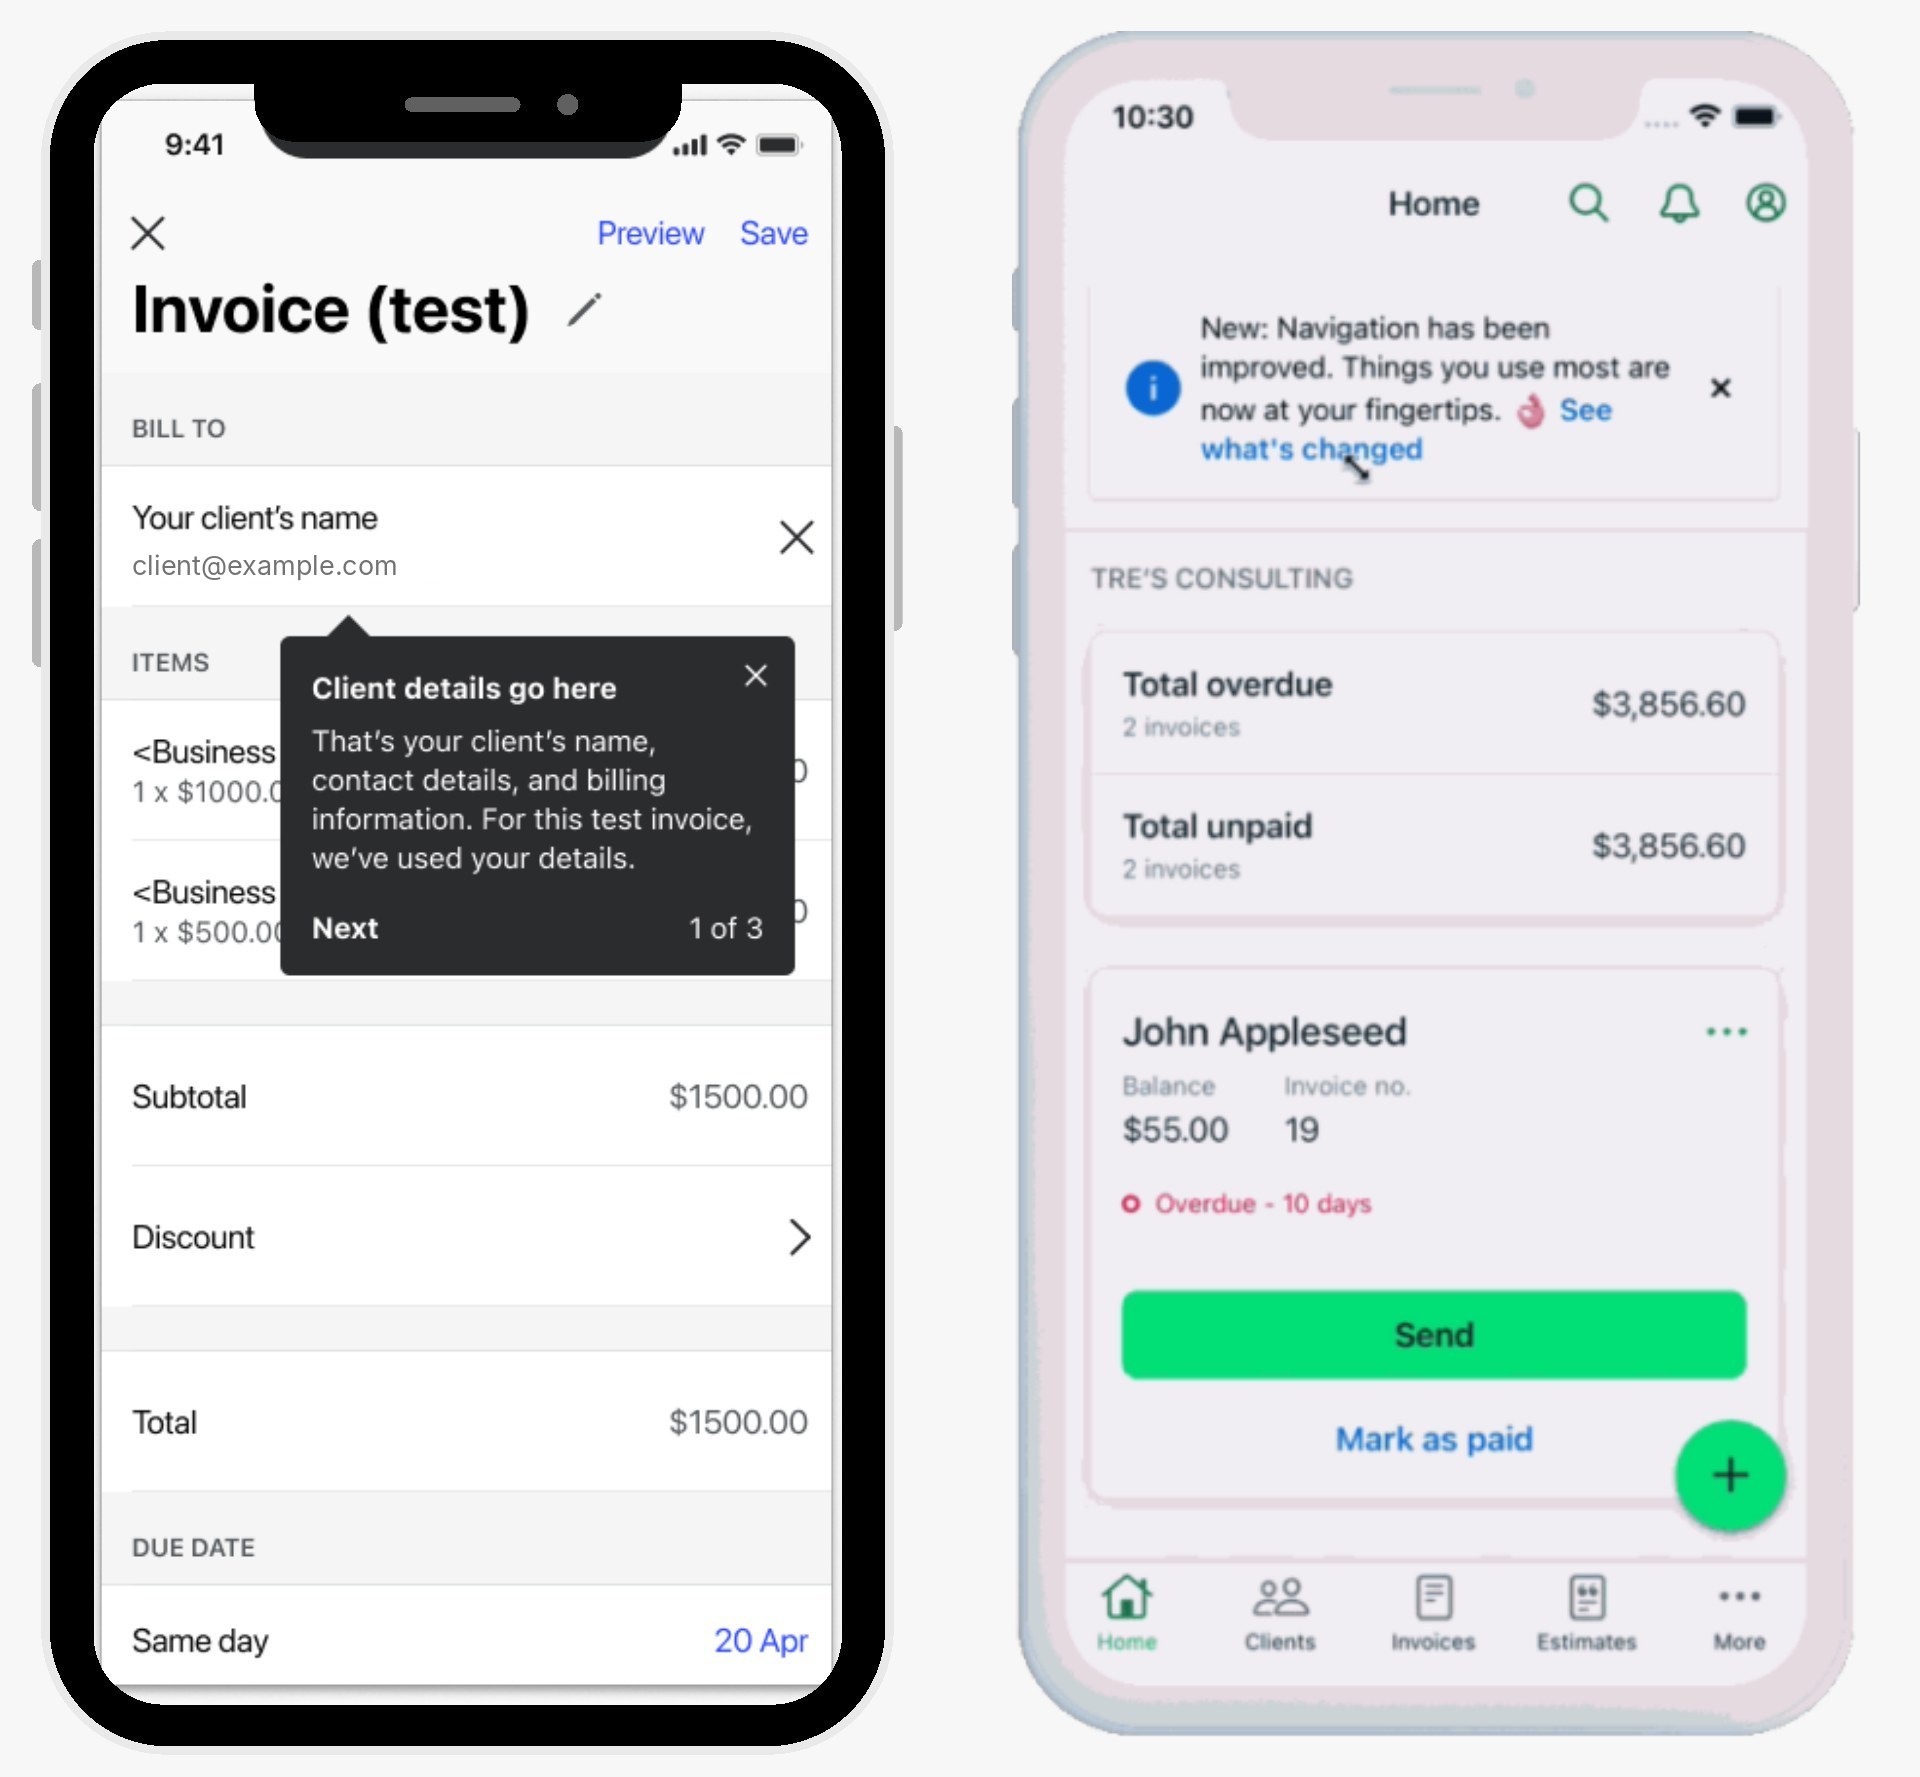
Onboarding people could choose. Because I was changing behaviour people had learned, I designed a tooltip tour. The tooltip was a common way to tour changes, which I confirmed by researching onboarding patterns first. The decision that mattered was making it optional: people started it from an information banner when they were ready, instead of being forced through it on the first launch. The tooltip had a counter to set expectations (such as “1 of 4”), blue to signal information, and settings to turn parts on or off per component.
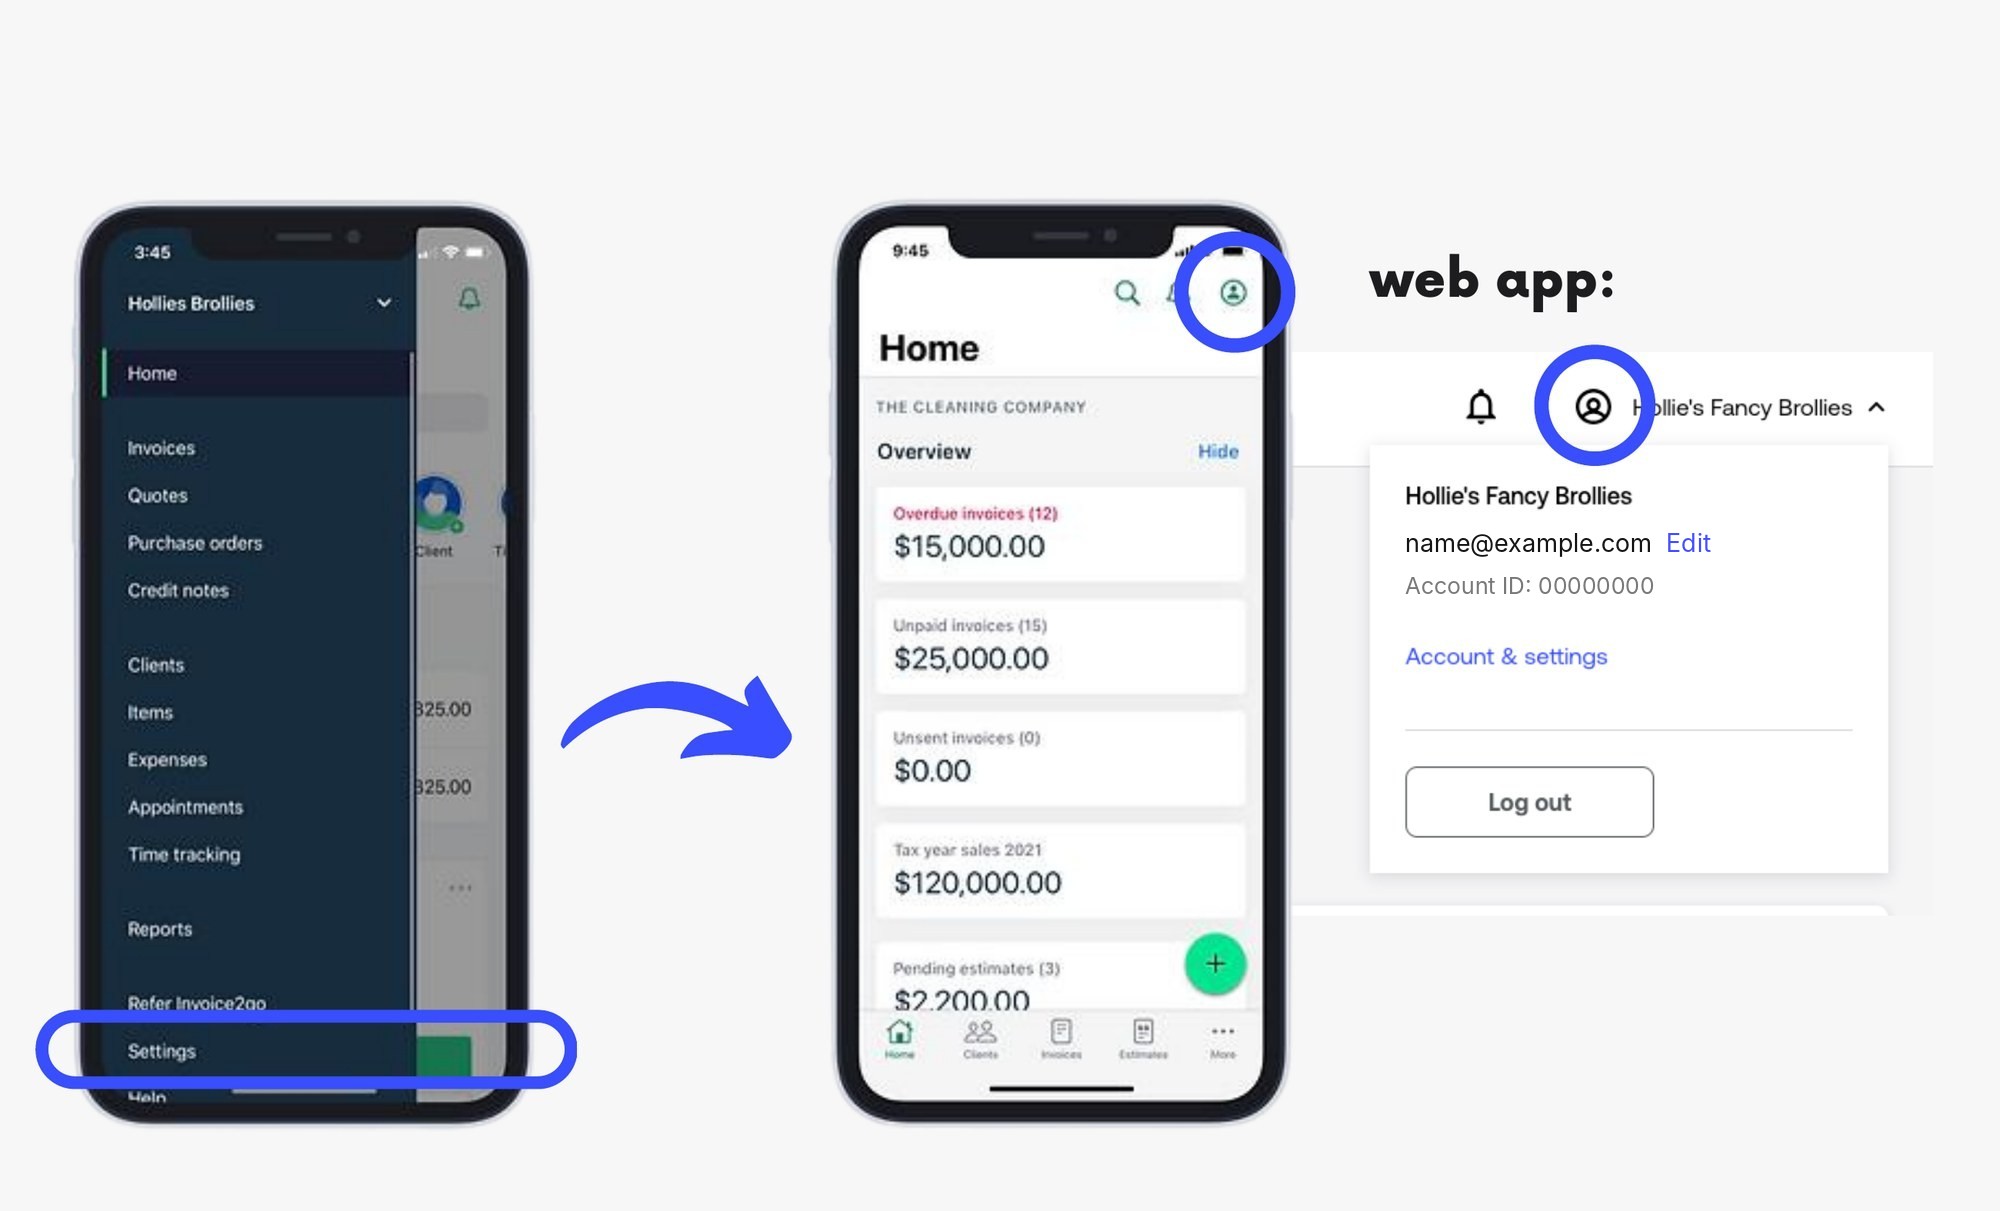
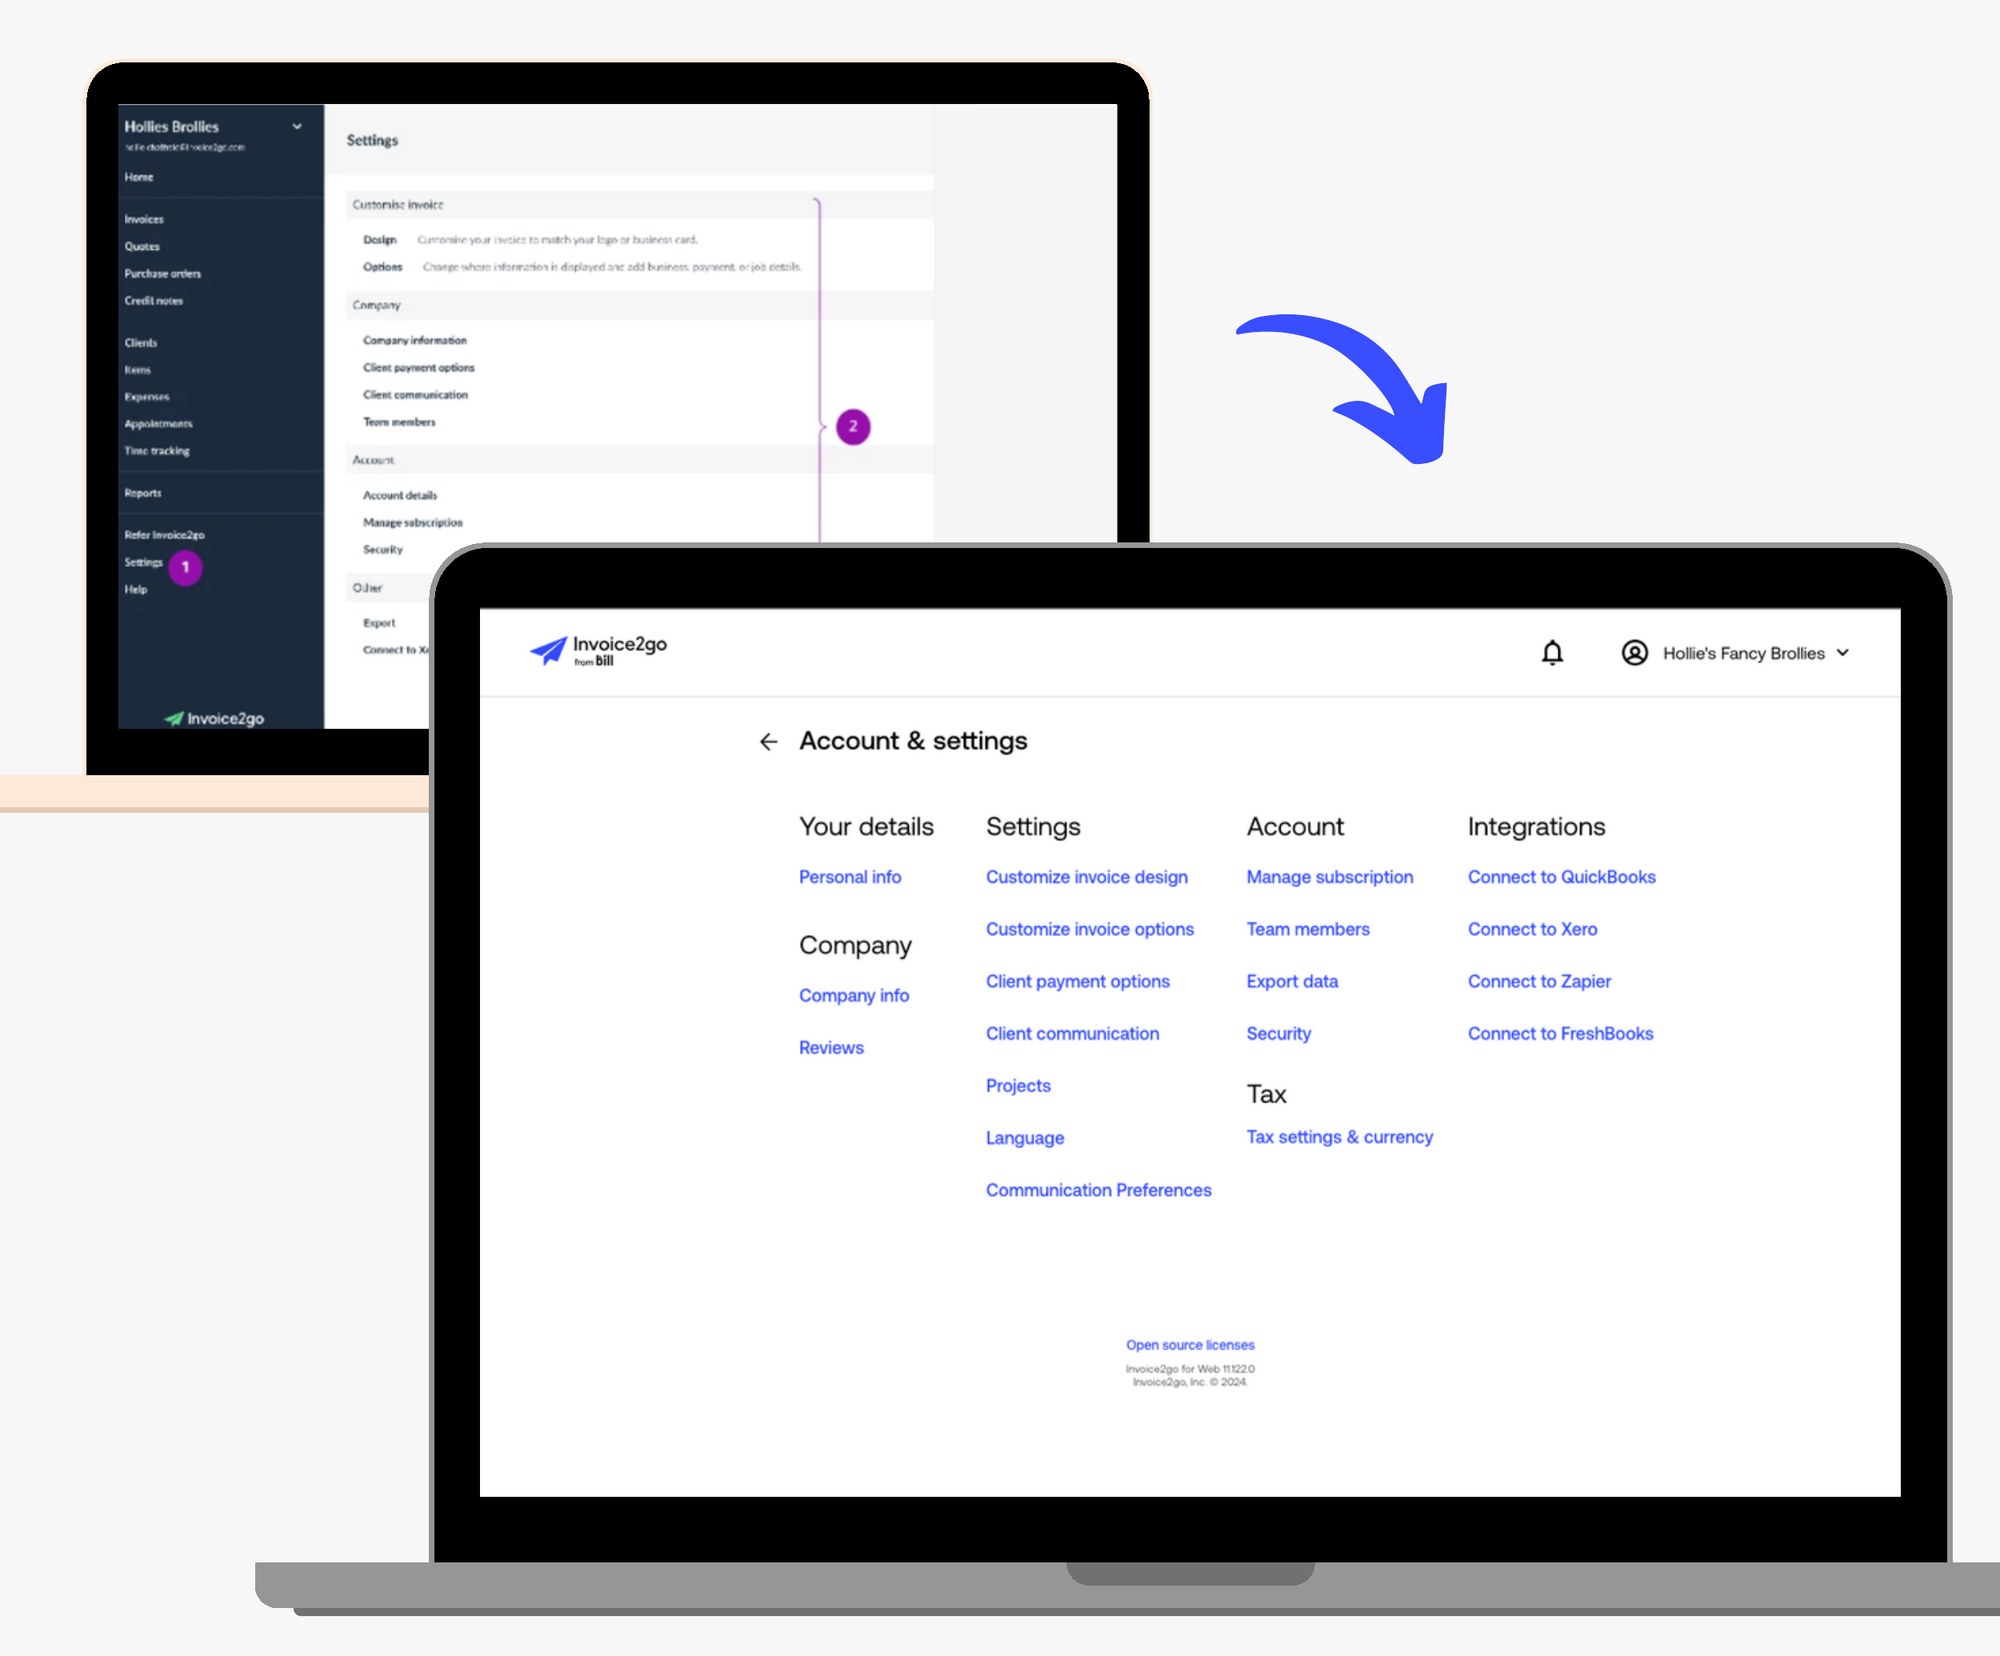
Web navigation that matches mobile. On web, I redesigned the top navigation to match the mobile experience, and moved notifications and global search into a persistent header, available everywhere instead of only on the homepage. People who moved between mobile and web would find the same structure on both. With the menu gone, the profile icon became the single way into both account and settings, which testing had supported.
The web app also had non-responsive pages, an old design system and poor accessibility. Since we were already reordering content and moving entry points, I asked the product manager why we wouldn’t also uplift the visual style of the settings pages, and we did.
I pushed for a phased rollout, against “just ship it”
We were changing navigation patterns that over 220,000 people had learned. Some stakeholders wanted to ship it and move on, but I argued the risk was too high. If it went wrong at scale, we’d face a heavy support load, bad reviews and possibly churn. Phasing would let us test our assumptions with real usage, catch problems while the blast radius was small, and build confidence across the organisation.
The plan:
- Phase 1: 5% of mobile app users, closely monitored for two weeks.
- Phase 2: larger segments, based on the success metrics.
- Phase 3: the web app, after mobile was validated.
- Phase 4: 100%, only once success was proven.
We tracked time to reach key features, first-time feature use, organic retention and task completion, with dashboards I set up with the Data Analyst so we could spot problems quickly.
It paid off early. In Phase 1 we saw confusion around where the Account icon sat, and refined the onboarding messaging before scaling up. That confusion reached about 11,000 people, not 220,000. By the time we reached 100%, stakeholders could see the metrics themselves.
What changed
In the first 30 days after release, among new customers:
- Average invoice engagement rose 21%, estimates engagement 19%, and profile engagement 11%.
- Average call volumes about settings discoverability fell 11%, and about feature discoverability fell 7%.
- Other teams reused the tooltip pattern three times, so I documented its anatomy, do’s and don’ts and FAQs in the design system.
- The bucketing model gave the team a clear structure for adding features, which had been a persistent problem.
What I learned
Navigation is never only navigation. What begins as “let’s fix the menu” becomes “let’s rethink how the product is structured”, and small changes ripple through the whole system. It also reached marketing materials, email templates, support documentation and onboarding flows, so I’d bring marketing and customer support in much earlier next time.
You can’t satisfy every mental model. People organise information differently. Don’t expect clear next steps from testing an IA. The research told us to pick the most common models and support people through the change, and multiple entry points help where one place can’t suit everyone.
Change management is part of the design. Optional, user-triggered onboarding cut friction and backlash because people could learn at their own pace.
The framework matters more than the structure. We built the best structure we could with what we knew, and products keep changing. The lasting value was a clear way of deciding where new things go.