The challenge: a business model change, with onboarding in the way
Invoice2go made most of its money from subscriptions. The company was shifting towards payments revenue, which meant more new users needed to set up online payments, and to see the product as a financial tool rather than an invoice maker.
The goals were a day-one payment adoption rate above 10%, a subscriber rate above 17%, and a product that felt different from the first session. I was the designer on the project, working with product, engineering, research and marketing, and later led the designers working on it as I moved into a management role.
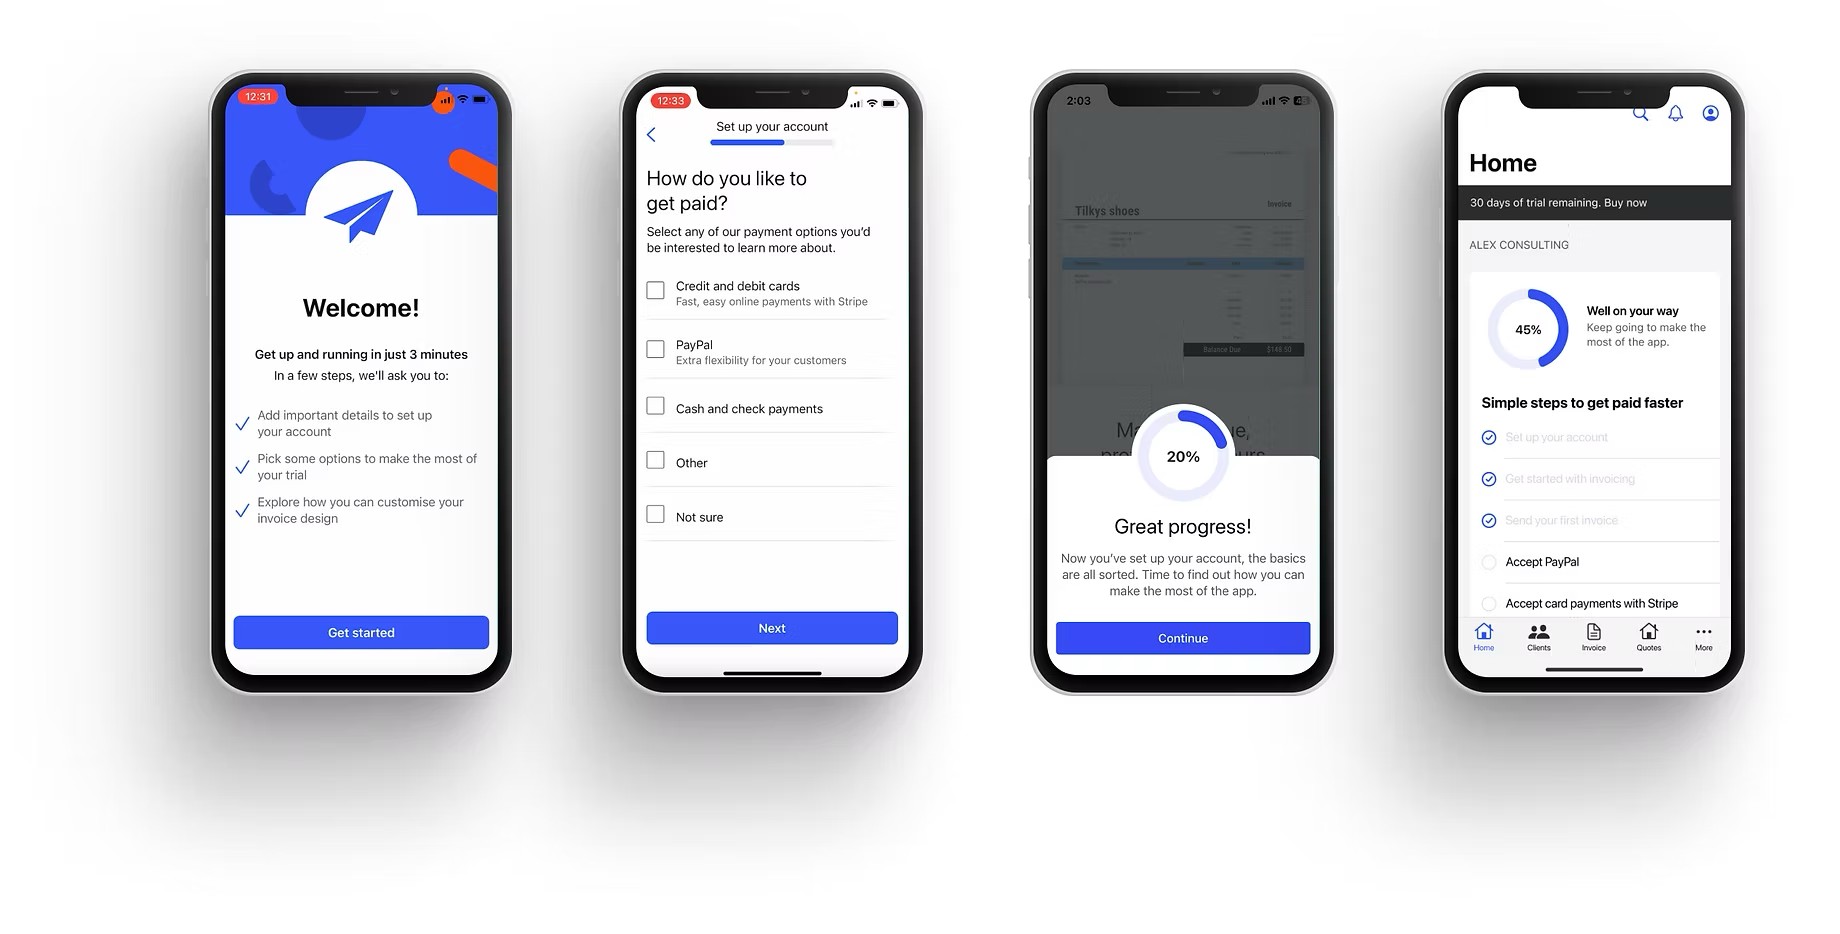
The starting point was thin: a single-question signup, no feature onboarding and a basic task list. We wanted a supportive setup flow, guidance to value earlier, a personalised task list, a test invoice and contextual nudges.
What the data said: people wanted payments and never got there
Trialists who set up payments subscribed at five to six times the rate of those who didn’t, and retained better. About 30% of new users chose “Getting paid faster” when asked what they needed help with, our signal that they wanted payments, yet 70% of them never set it up. Almost everyone who did set it up did it on day one, so day one was the window.
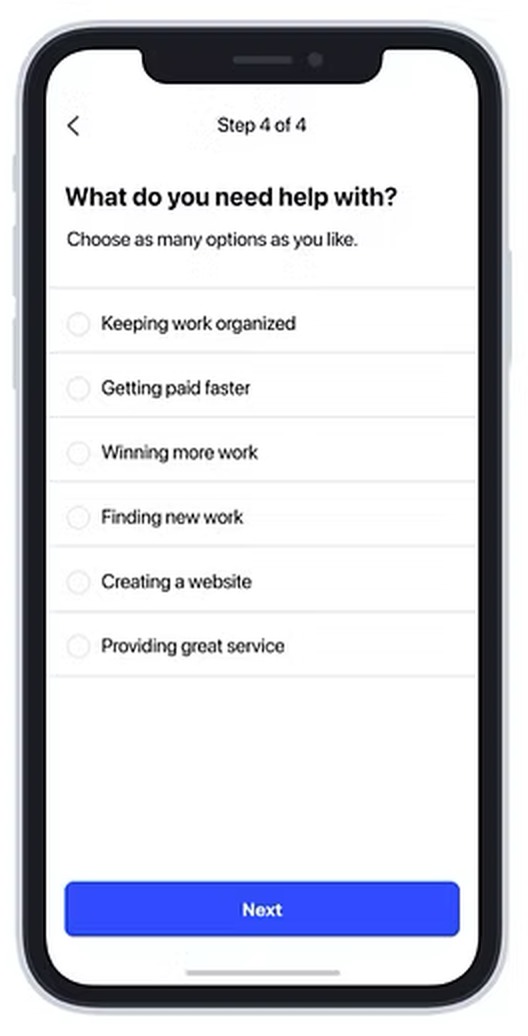
The wording of that option went through several rounds. Early versions were explicit about “setting up online payments”, and later ones were reframed around the goal.
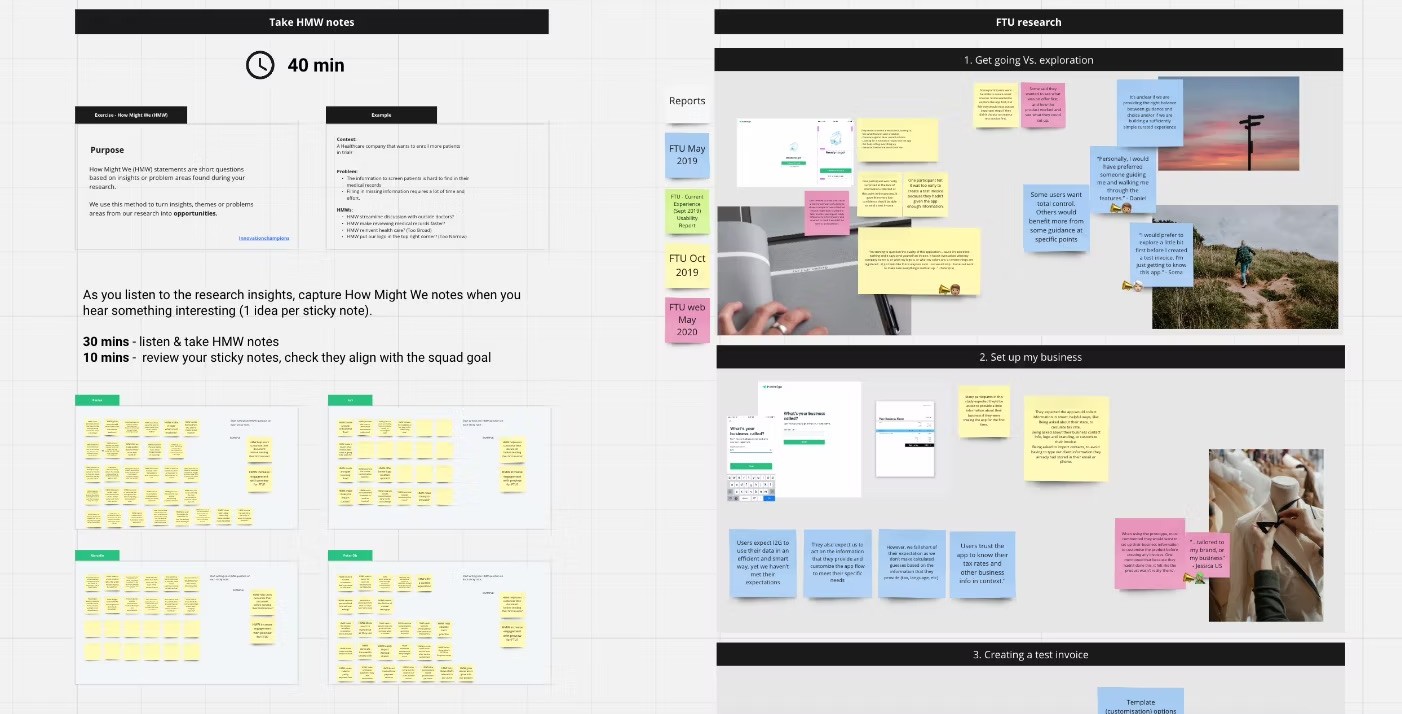
That reframed the problem. People weren’t rejecting payments. Our first-time experience simply wasn’t getting them there. I ran a workshop with product and engineering to turn the data and existing research into opportunities.
I designed the whole journey, not just the screens
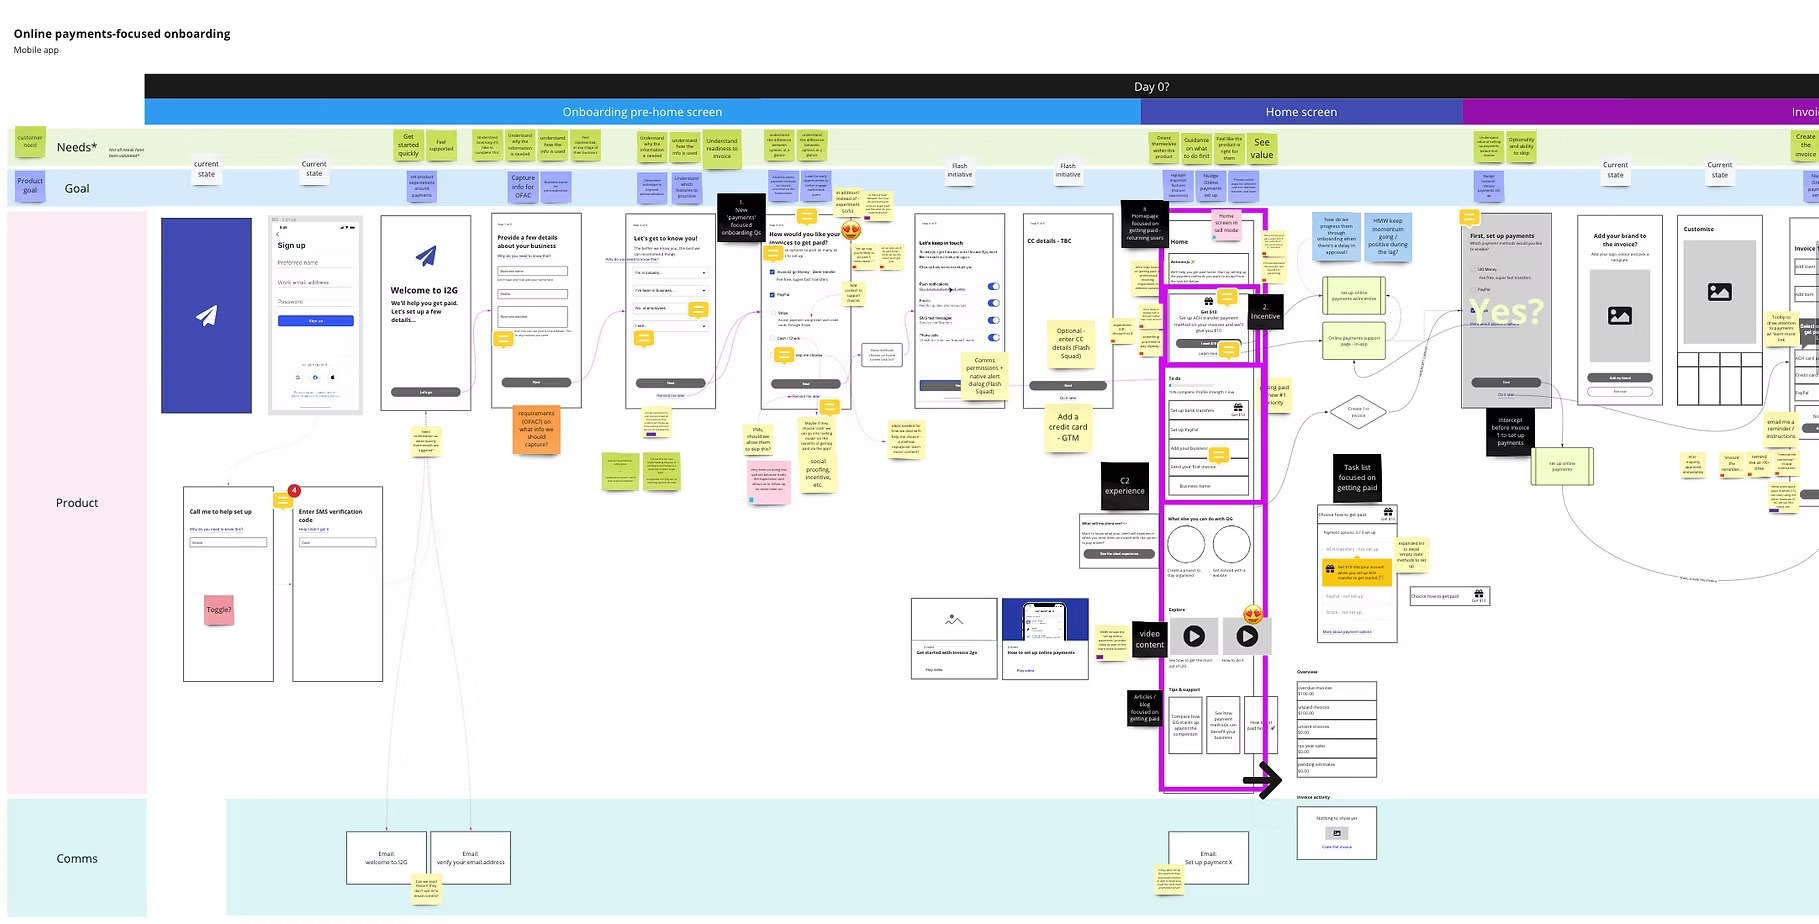
Onboarding at Invoice2go was a set of separate pieces: signup questions, a setup flow, and the home screen that followed. Fixing any one of them wouldn’t change how the first day felt, so I mapped the journey end to end, from install to first payment, and designed it as one experience. I worked with the marketing designer so the promise made before download matched what people met inside the app.
Research said: fewer questions, clearer expectations, a reason to continue
With the Senior Researcher, I tested a Figma prototype with US small business owners in remote sessions. The findings were consistent:
- There were too many questions at signup.
- People didn’t know what to expect or how long it would take.
- The incentives to finish were weak.
- People wanted to customise their invoices.
- Payment education worked best in context, when someone was about to use it.
- There was no resistance to a payments-first approach.
The last one mattered most. We had worried that leading with payments would put people off, and it didn’t.
I kept usability testing light on purpose. A prototype is a poor stand-in for real first-day behaviour, the concept we tested wasn’t far from what shipped, and the team’s culture was to release quickly and learn from the data. So the plan was to ship in phases and measure.
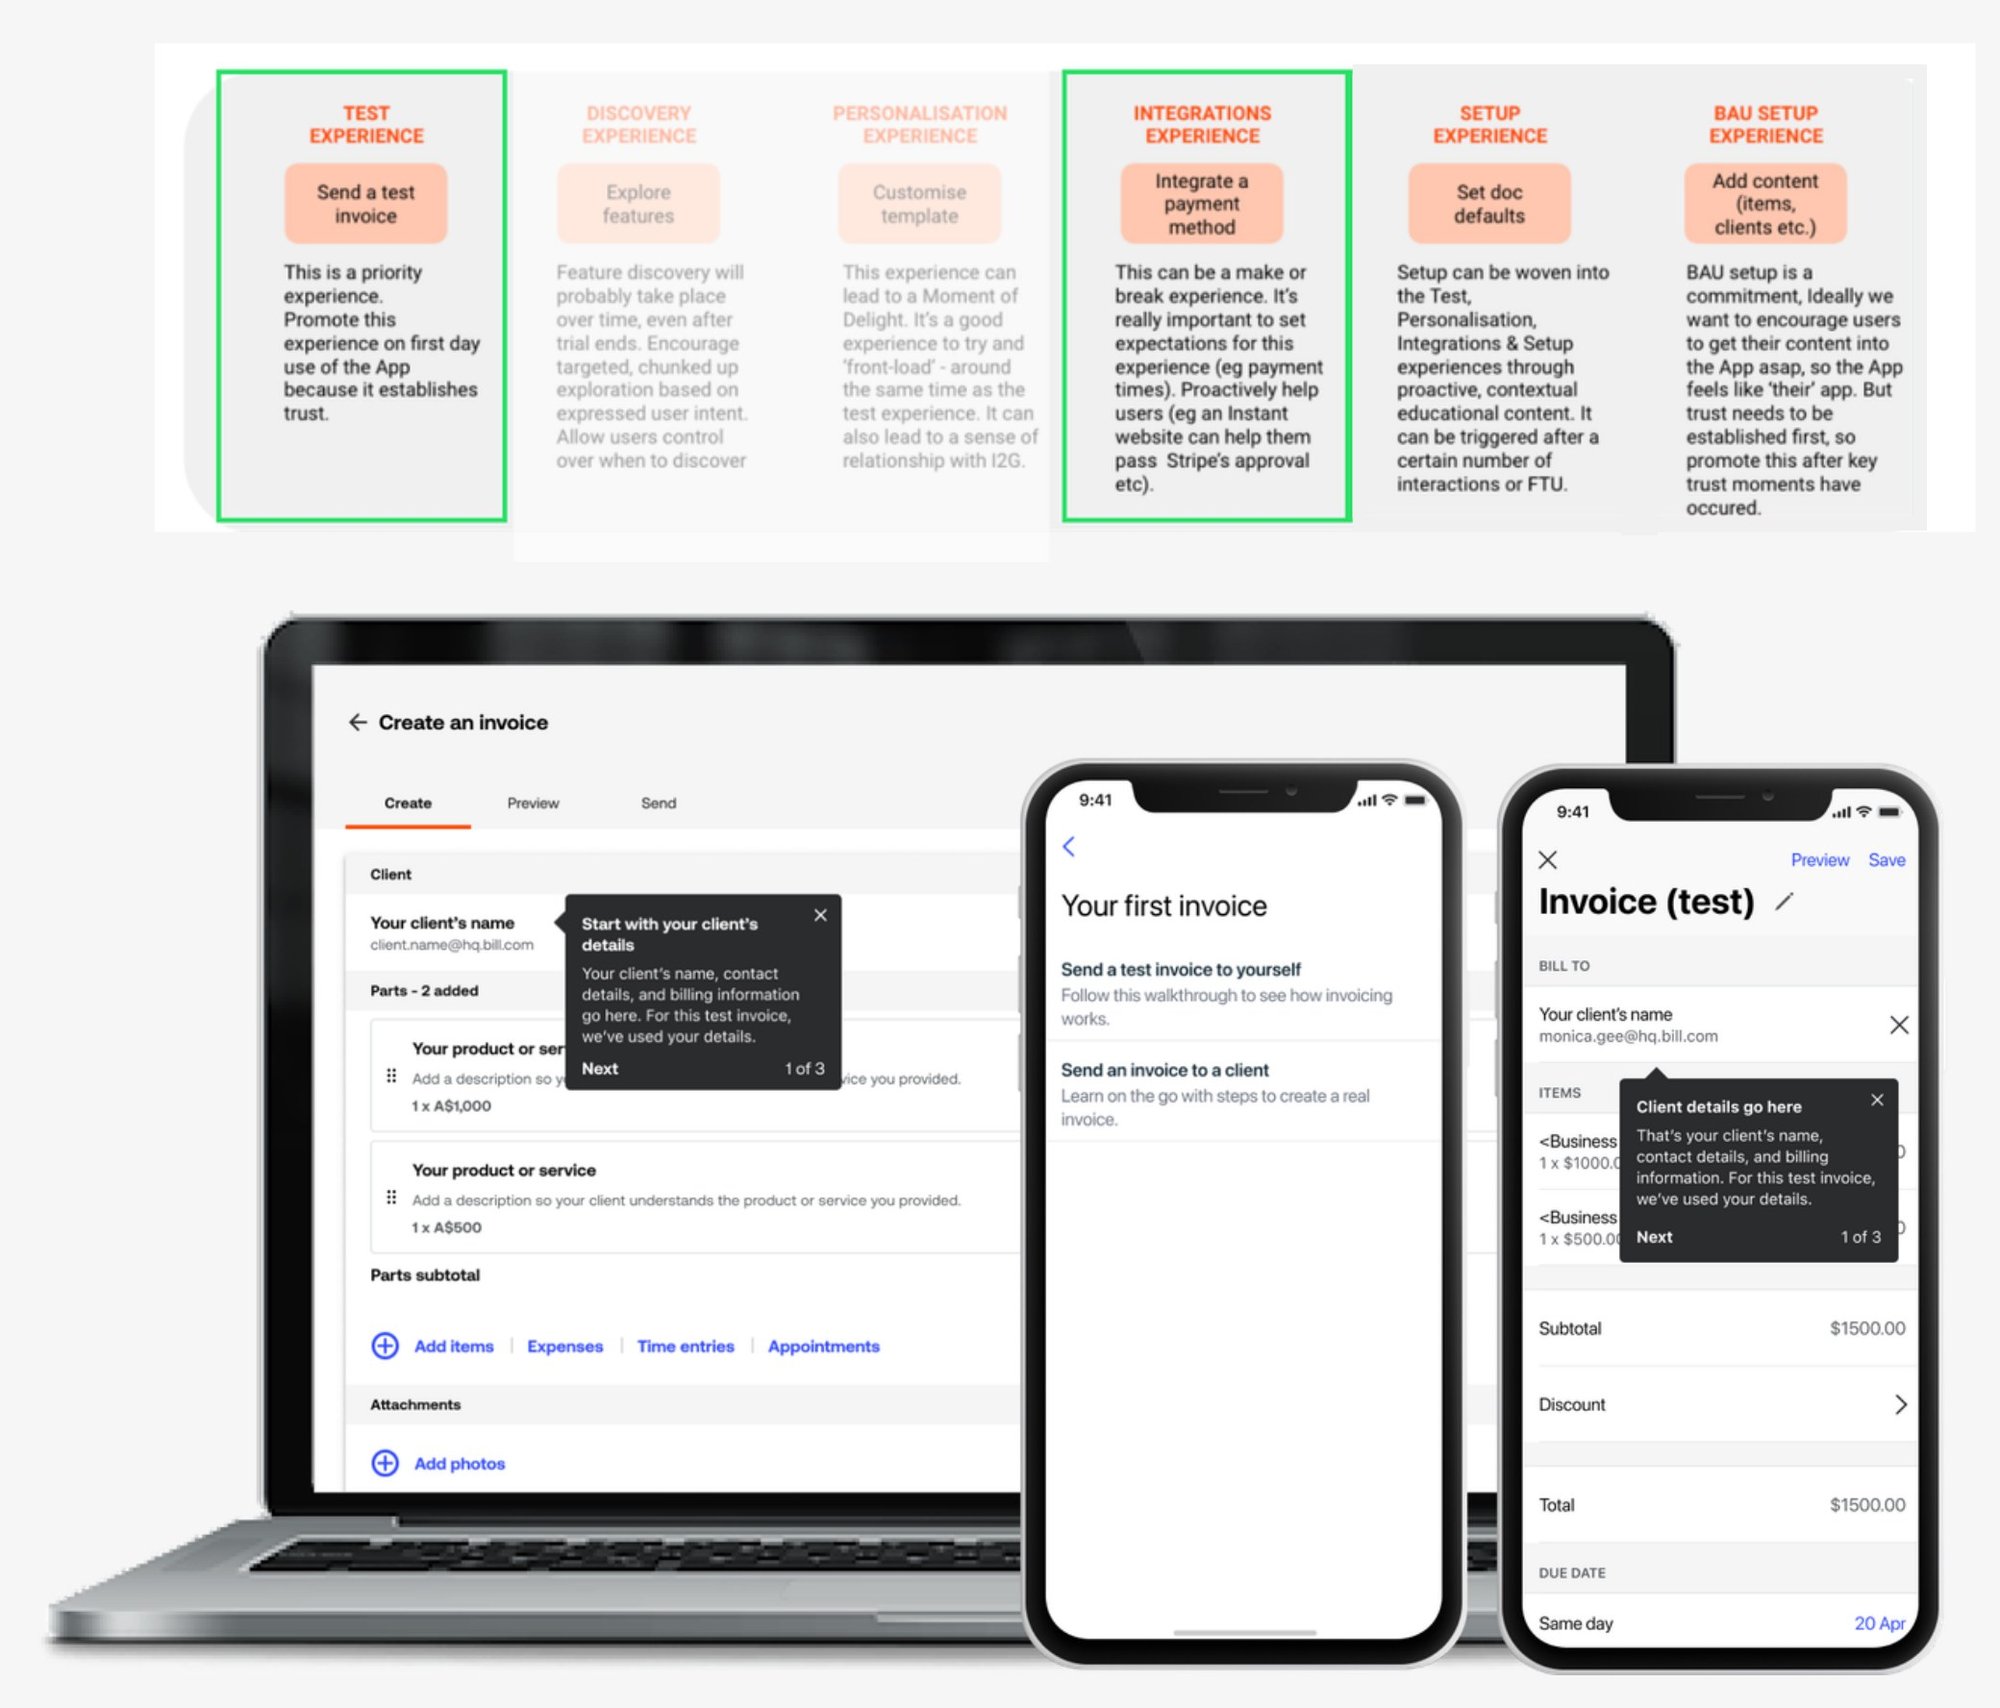
We also worked with Next Step, a behavioural science agency. Their guidance became three rules for the flow: every question has to add value for the person answering, progress is always visible, and the goal gets closer with each step, a goal-gradient effect that gets people to finish.
Two kinds of progress, and a web app with no header
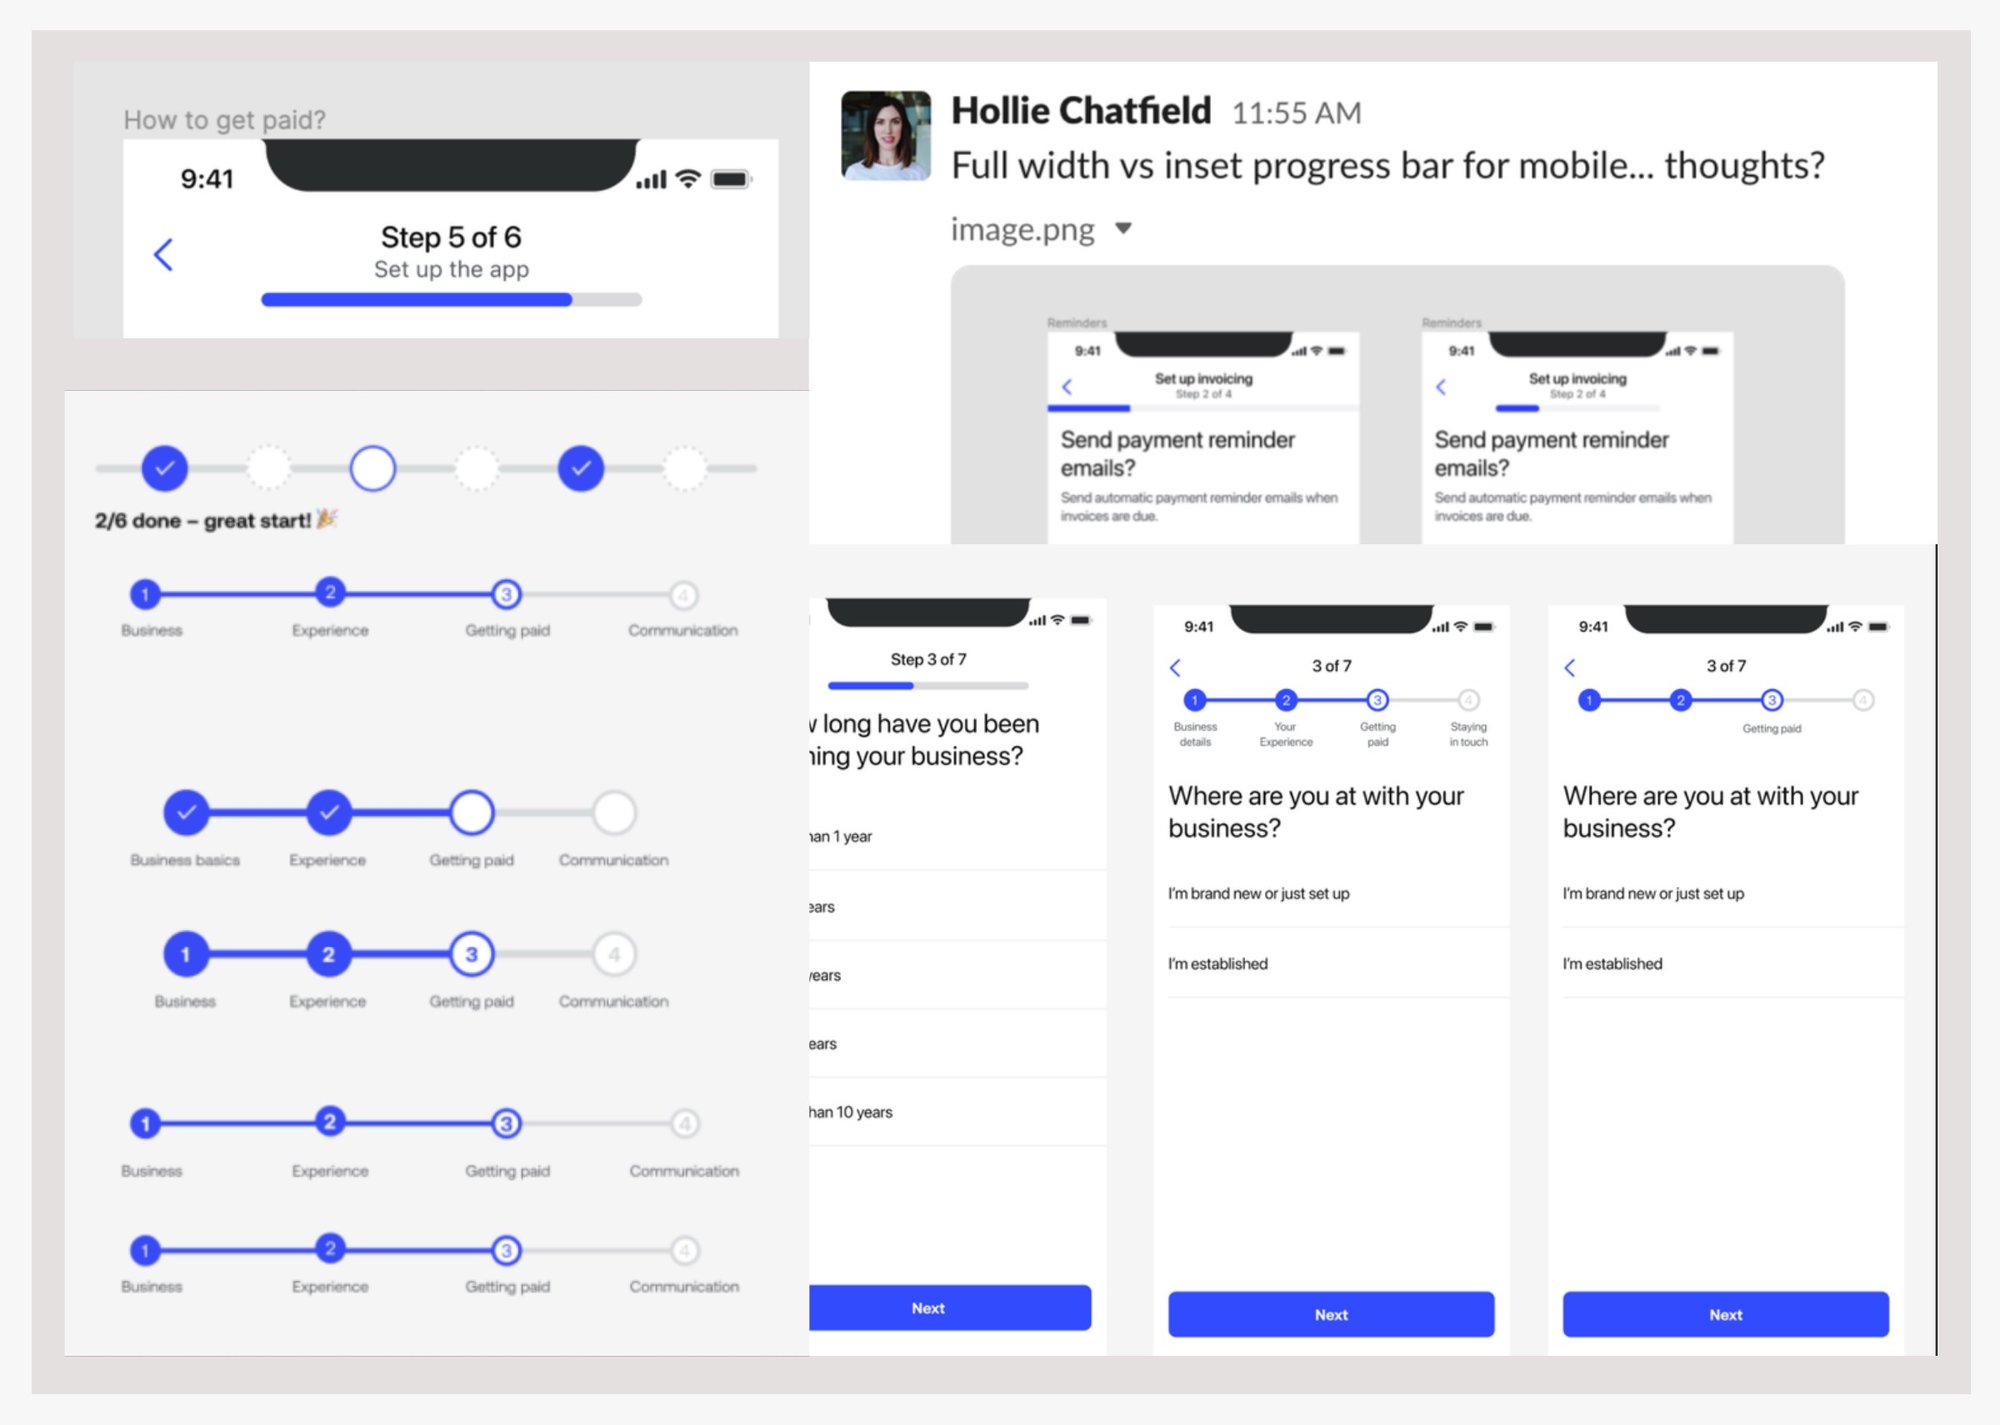
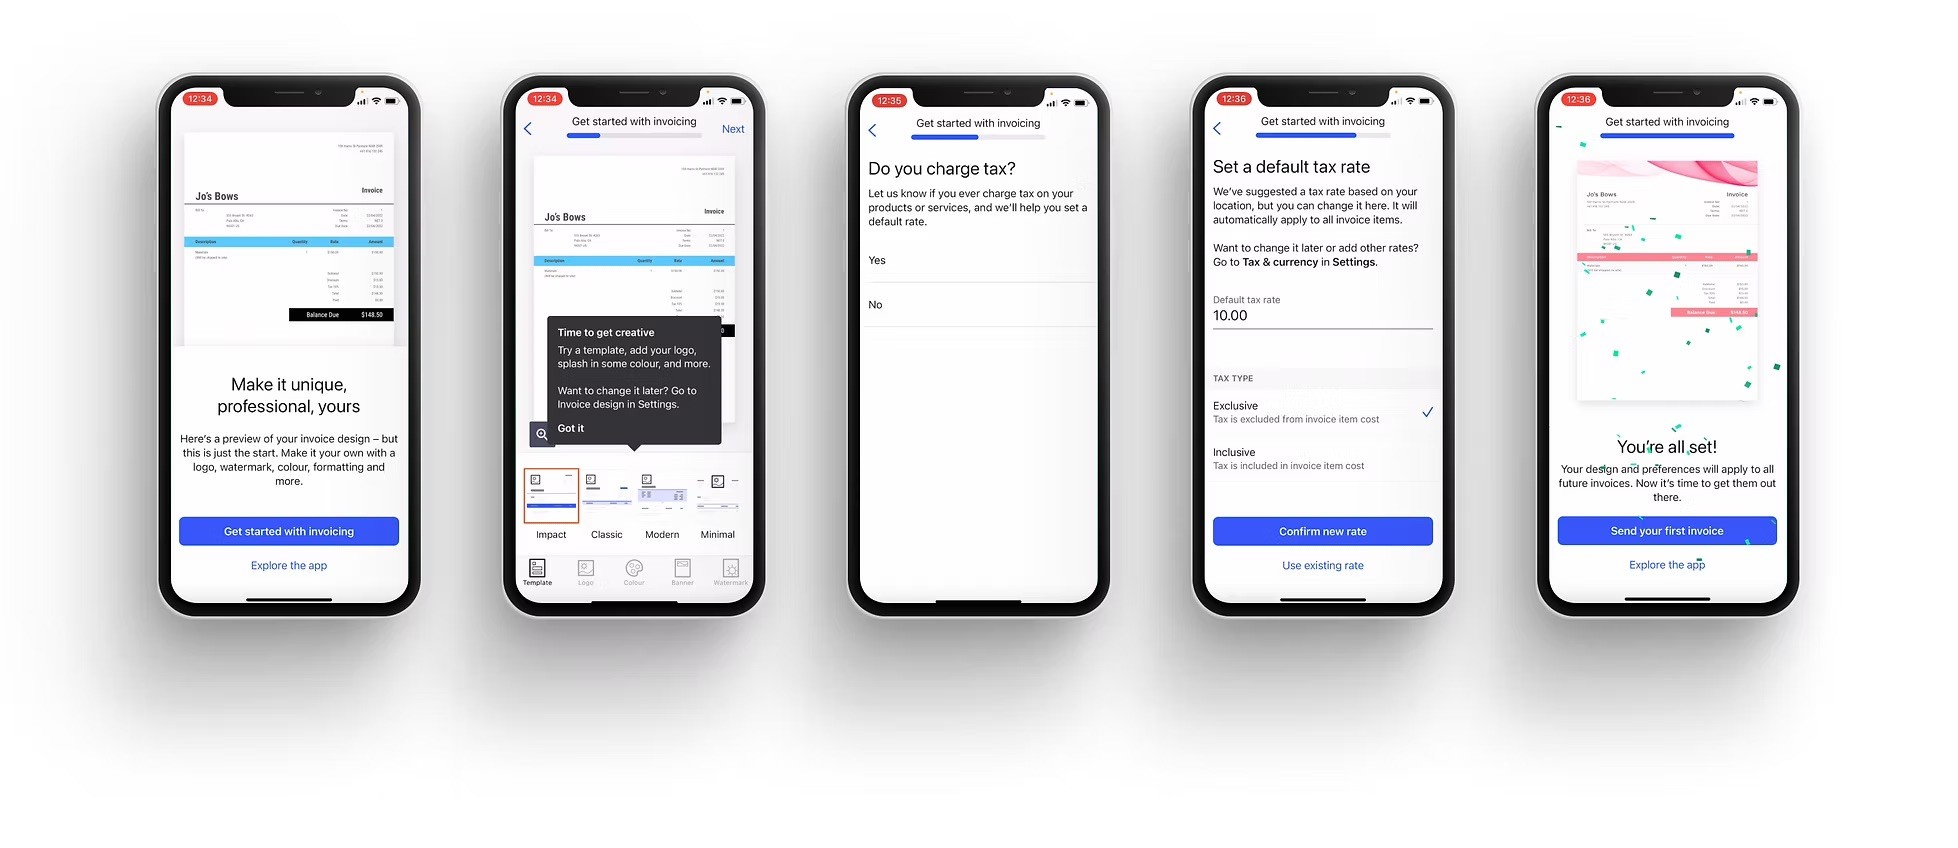
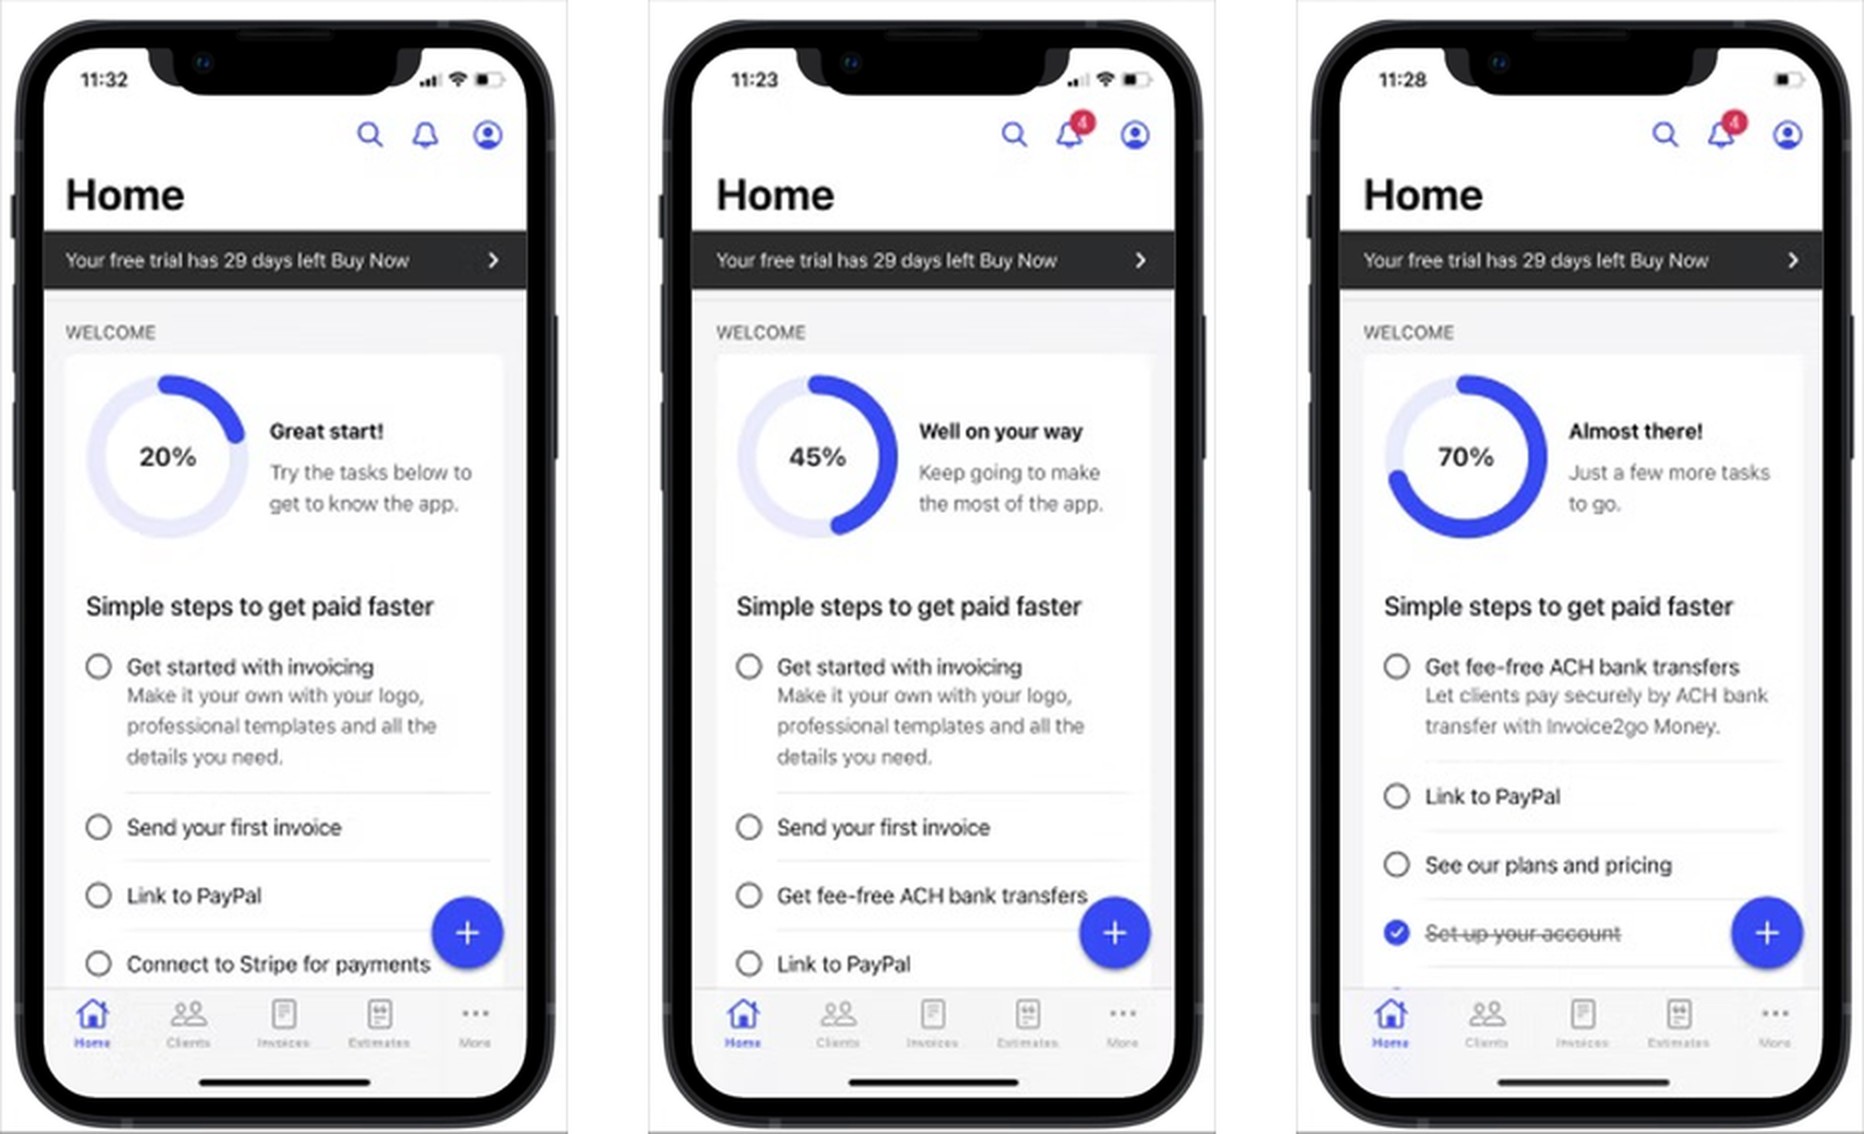
Showing progress raised a real design choice. A linear bar is accurate but makes a long flow feel long. A milestone approach feels like achievement but hides where you are. I used a bar for the setup steps and milestones for the task list that follows, so the 20%, 45% and 70% points on the home screen carry on from the bar in the flow.
I chose a horizontal bar because it scales: it adapts to a different number of steps and to narrow and wide screens without being redrawn.
I explored steppers, numbered steps and milestone graphics, and shared options with the team in Slack to get early reactions.
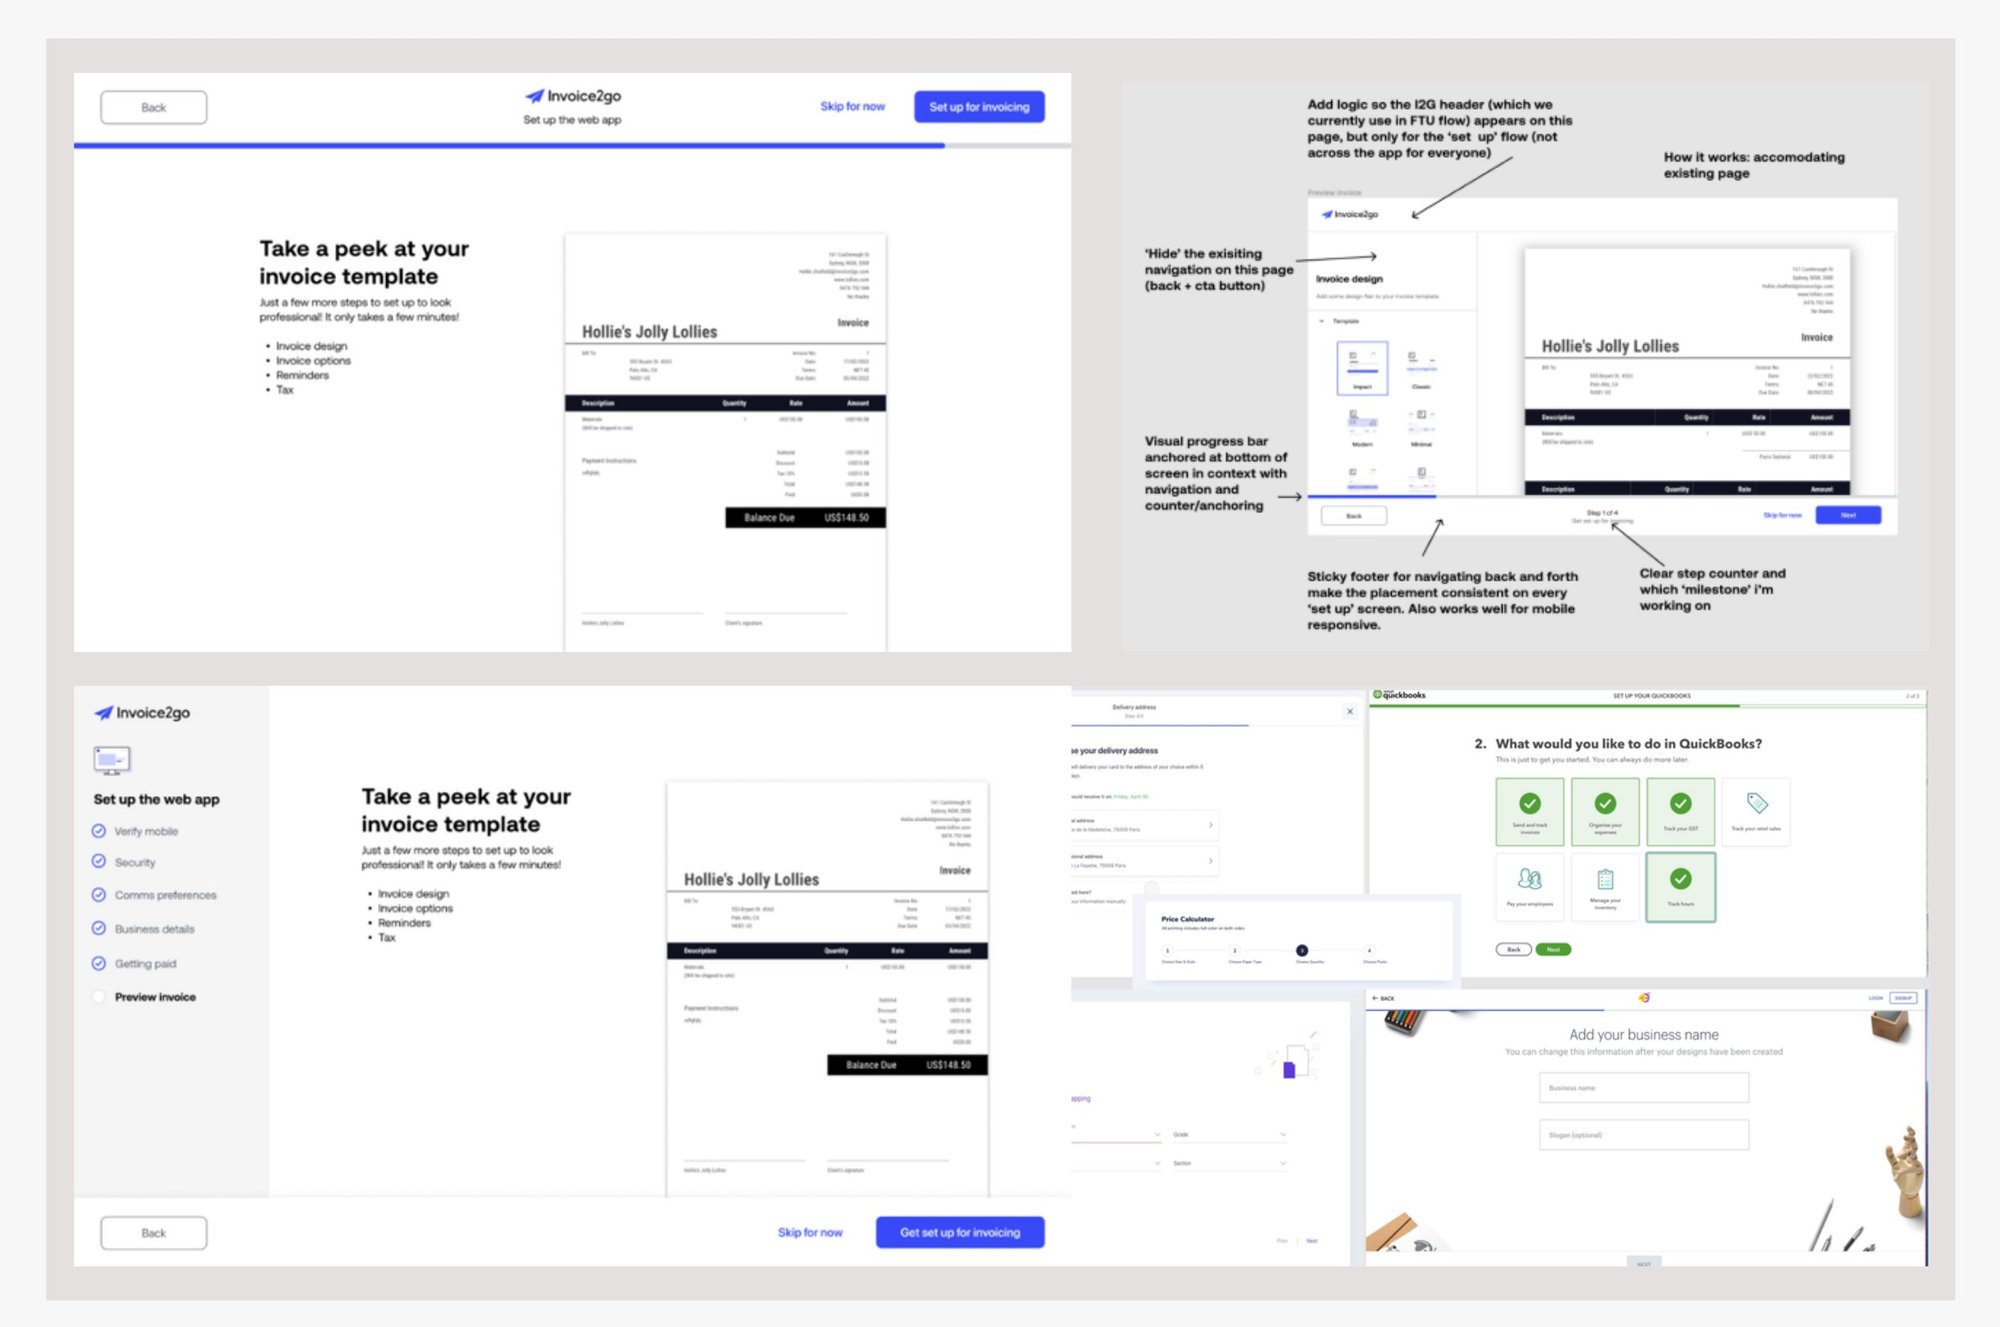
The web app had no header to hold a progress bar. I mocked up variations with the web engineer and reviewed them with the design systems team, and we agreed to validate the choice through FullStory recordings during rollout rather than debate it in advance.
Shipping in four phases
Each phase could ship and be measured on its own, which let us learn before committing to the next.
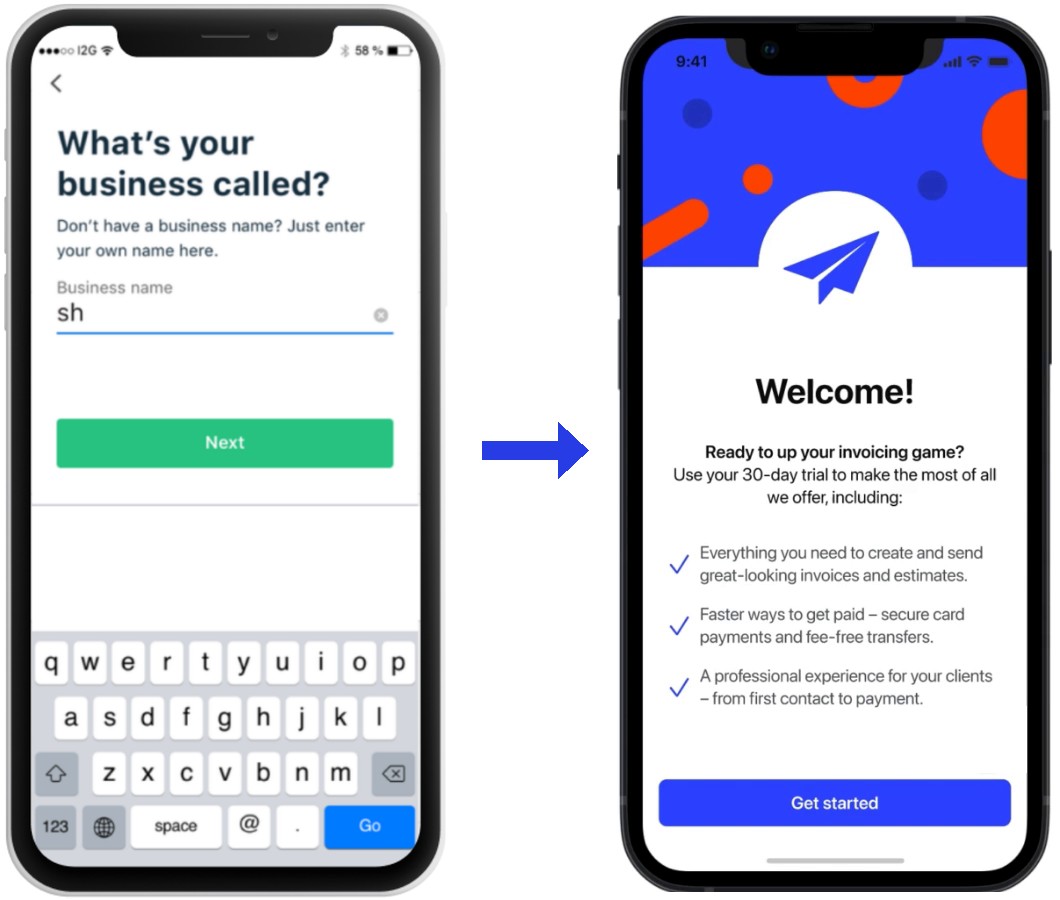
Phase 1: set up the account. I cut the signup questions to the ones that earned their place, and made the payments question part of the first few screens rather than something to find later.
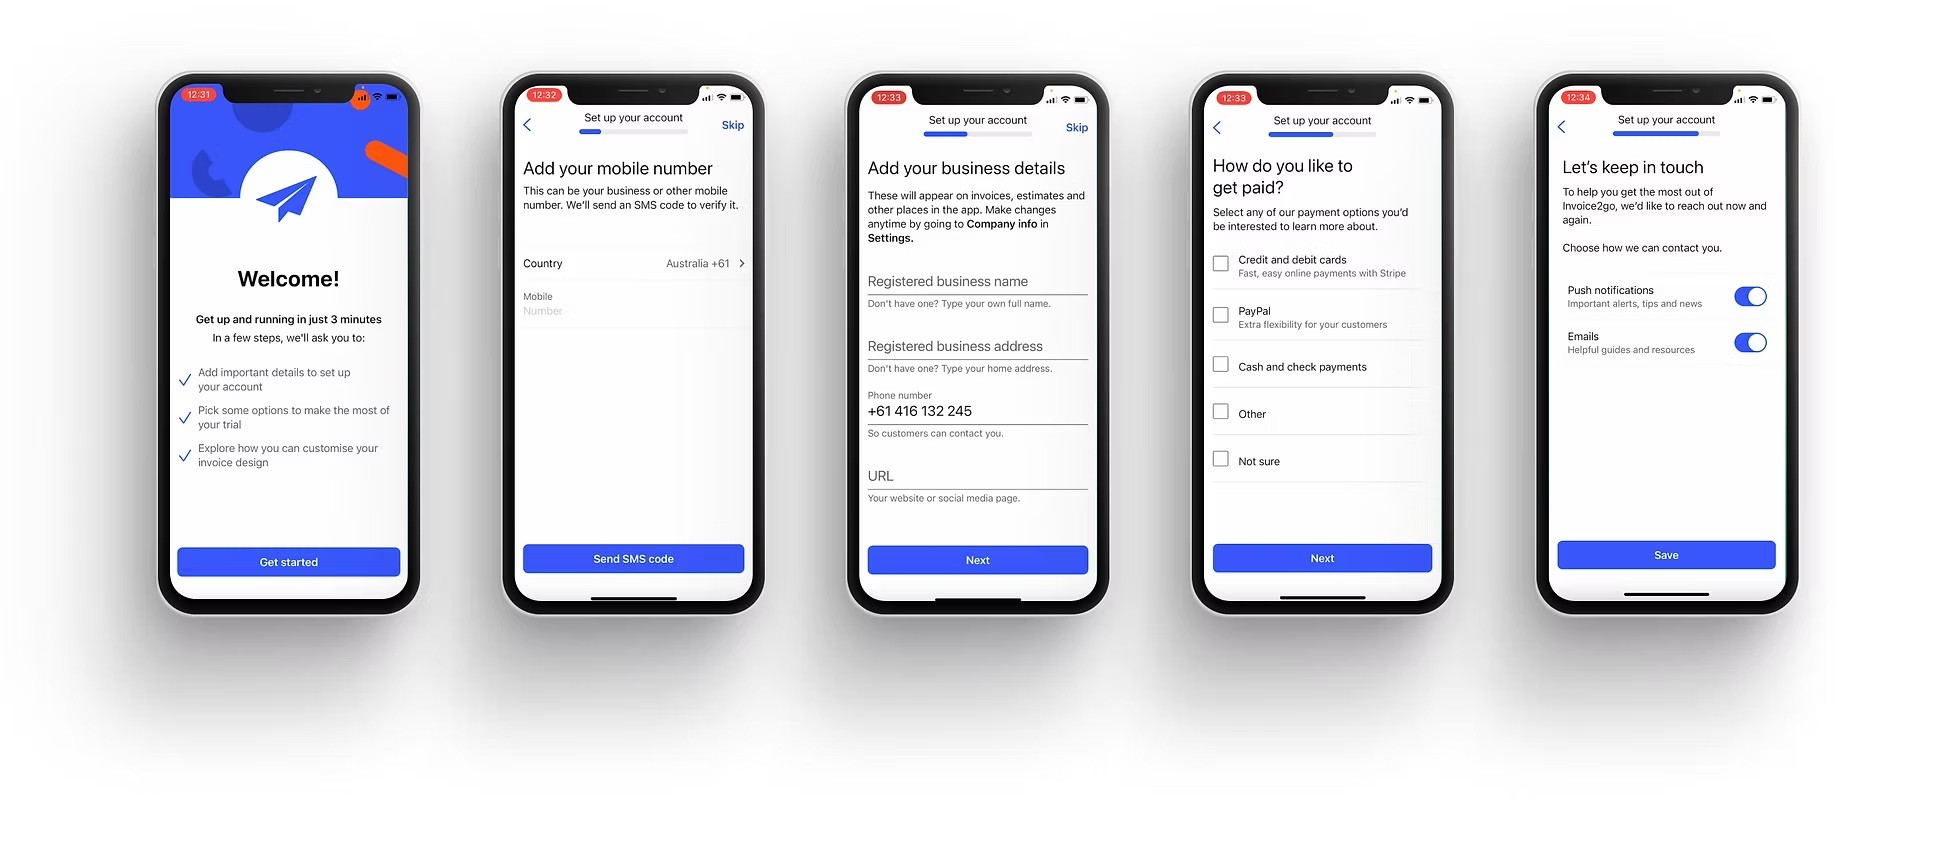
Phase 2: get ready to invoice. People set up a personalised invoice and their default tax, so their first invoice looked like theirs and took seconds to send. I embedded the existing customisation feature instead of building a new one, and finished with a confetti moment in Lottie to mark that they were set up.
Phase 3: a refreshed task list. The home screen now starts at 20% and gives the next step toward getting paid. I reused the Payments team’s education on payment methods so we explained it once, in the same words everywhere.
Phase 4: a test invoice. With dummy data, people could see invoicing work straight away. Tooltips highlighted the key areas and led them to send their first invoice.
No dead ends. People don’t always start at the beginning. If someone created an invoice from any entry point, a new context-setting screen funnelled them into the “get set up for invoicing” flow, with a reason for being there.
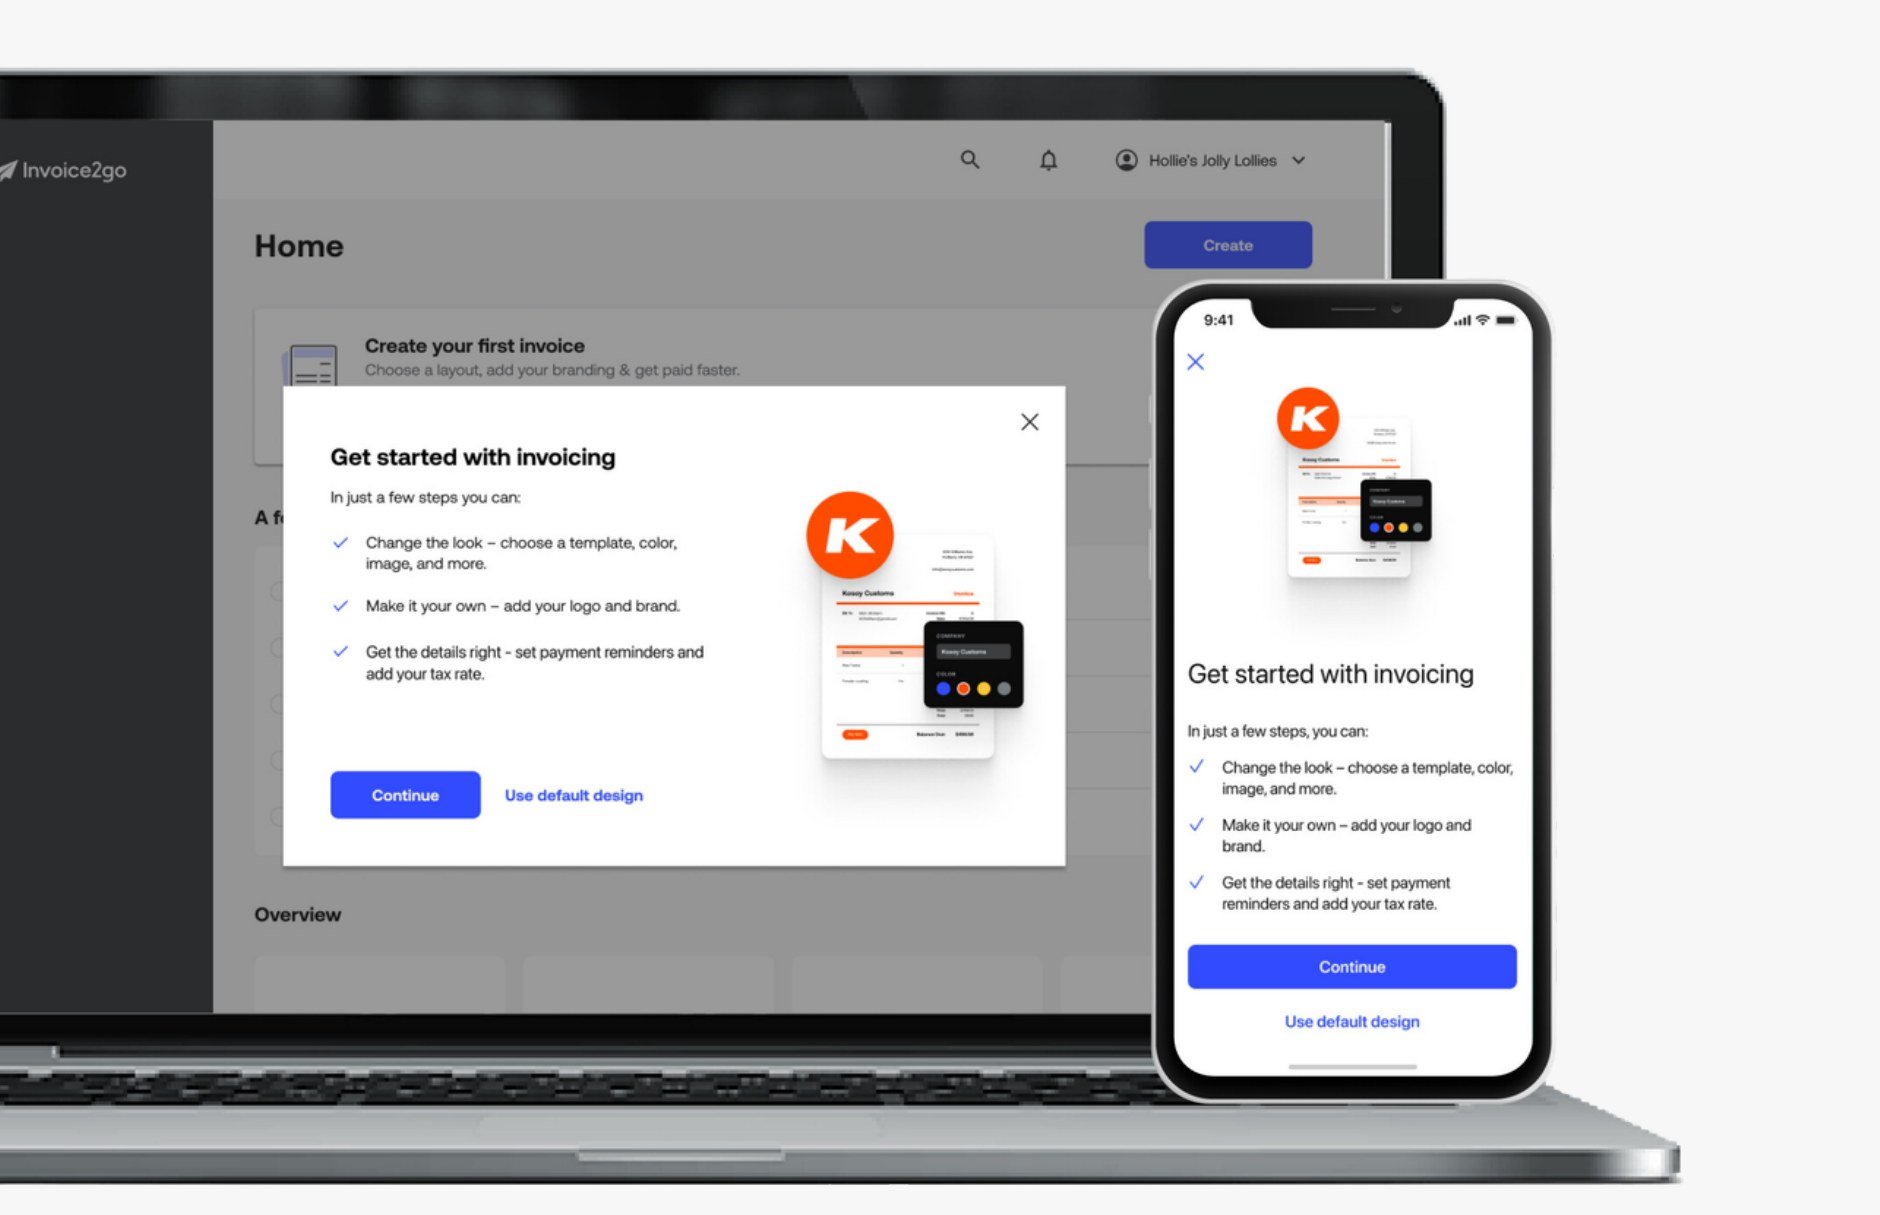
It shipped on iOS, Android and responsive web. We rolled it out to 10% of new users for two weeks before general availability, watching FullStory sessions for anything the numbers wouldn’t show.
Testing what I couldn’t settle in design
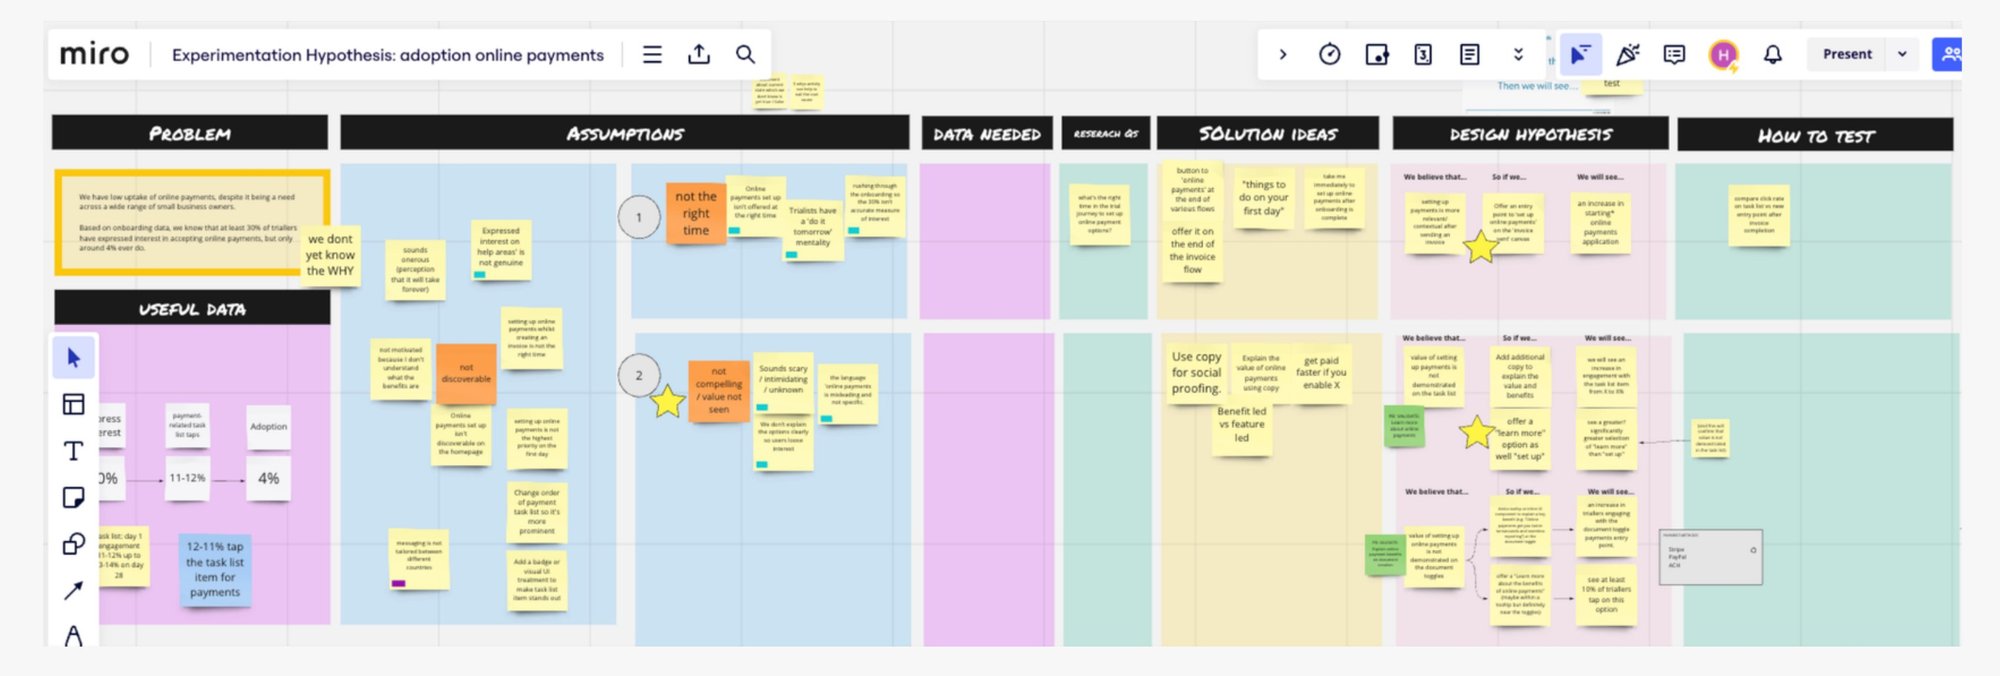
Some questions weren’t going to be answered by opinion, so I set up an experimentation board to track assumptions, hypotheses and tests.
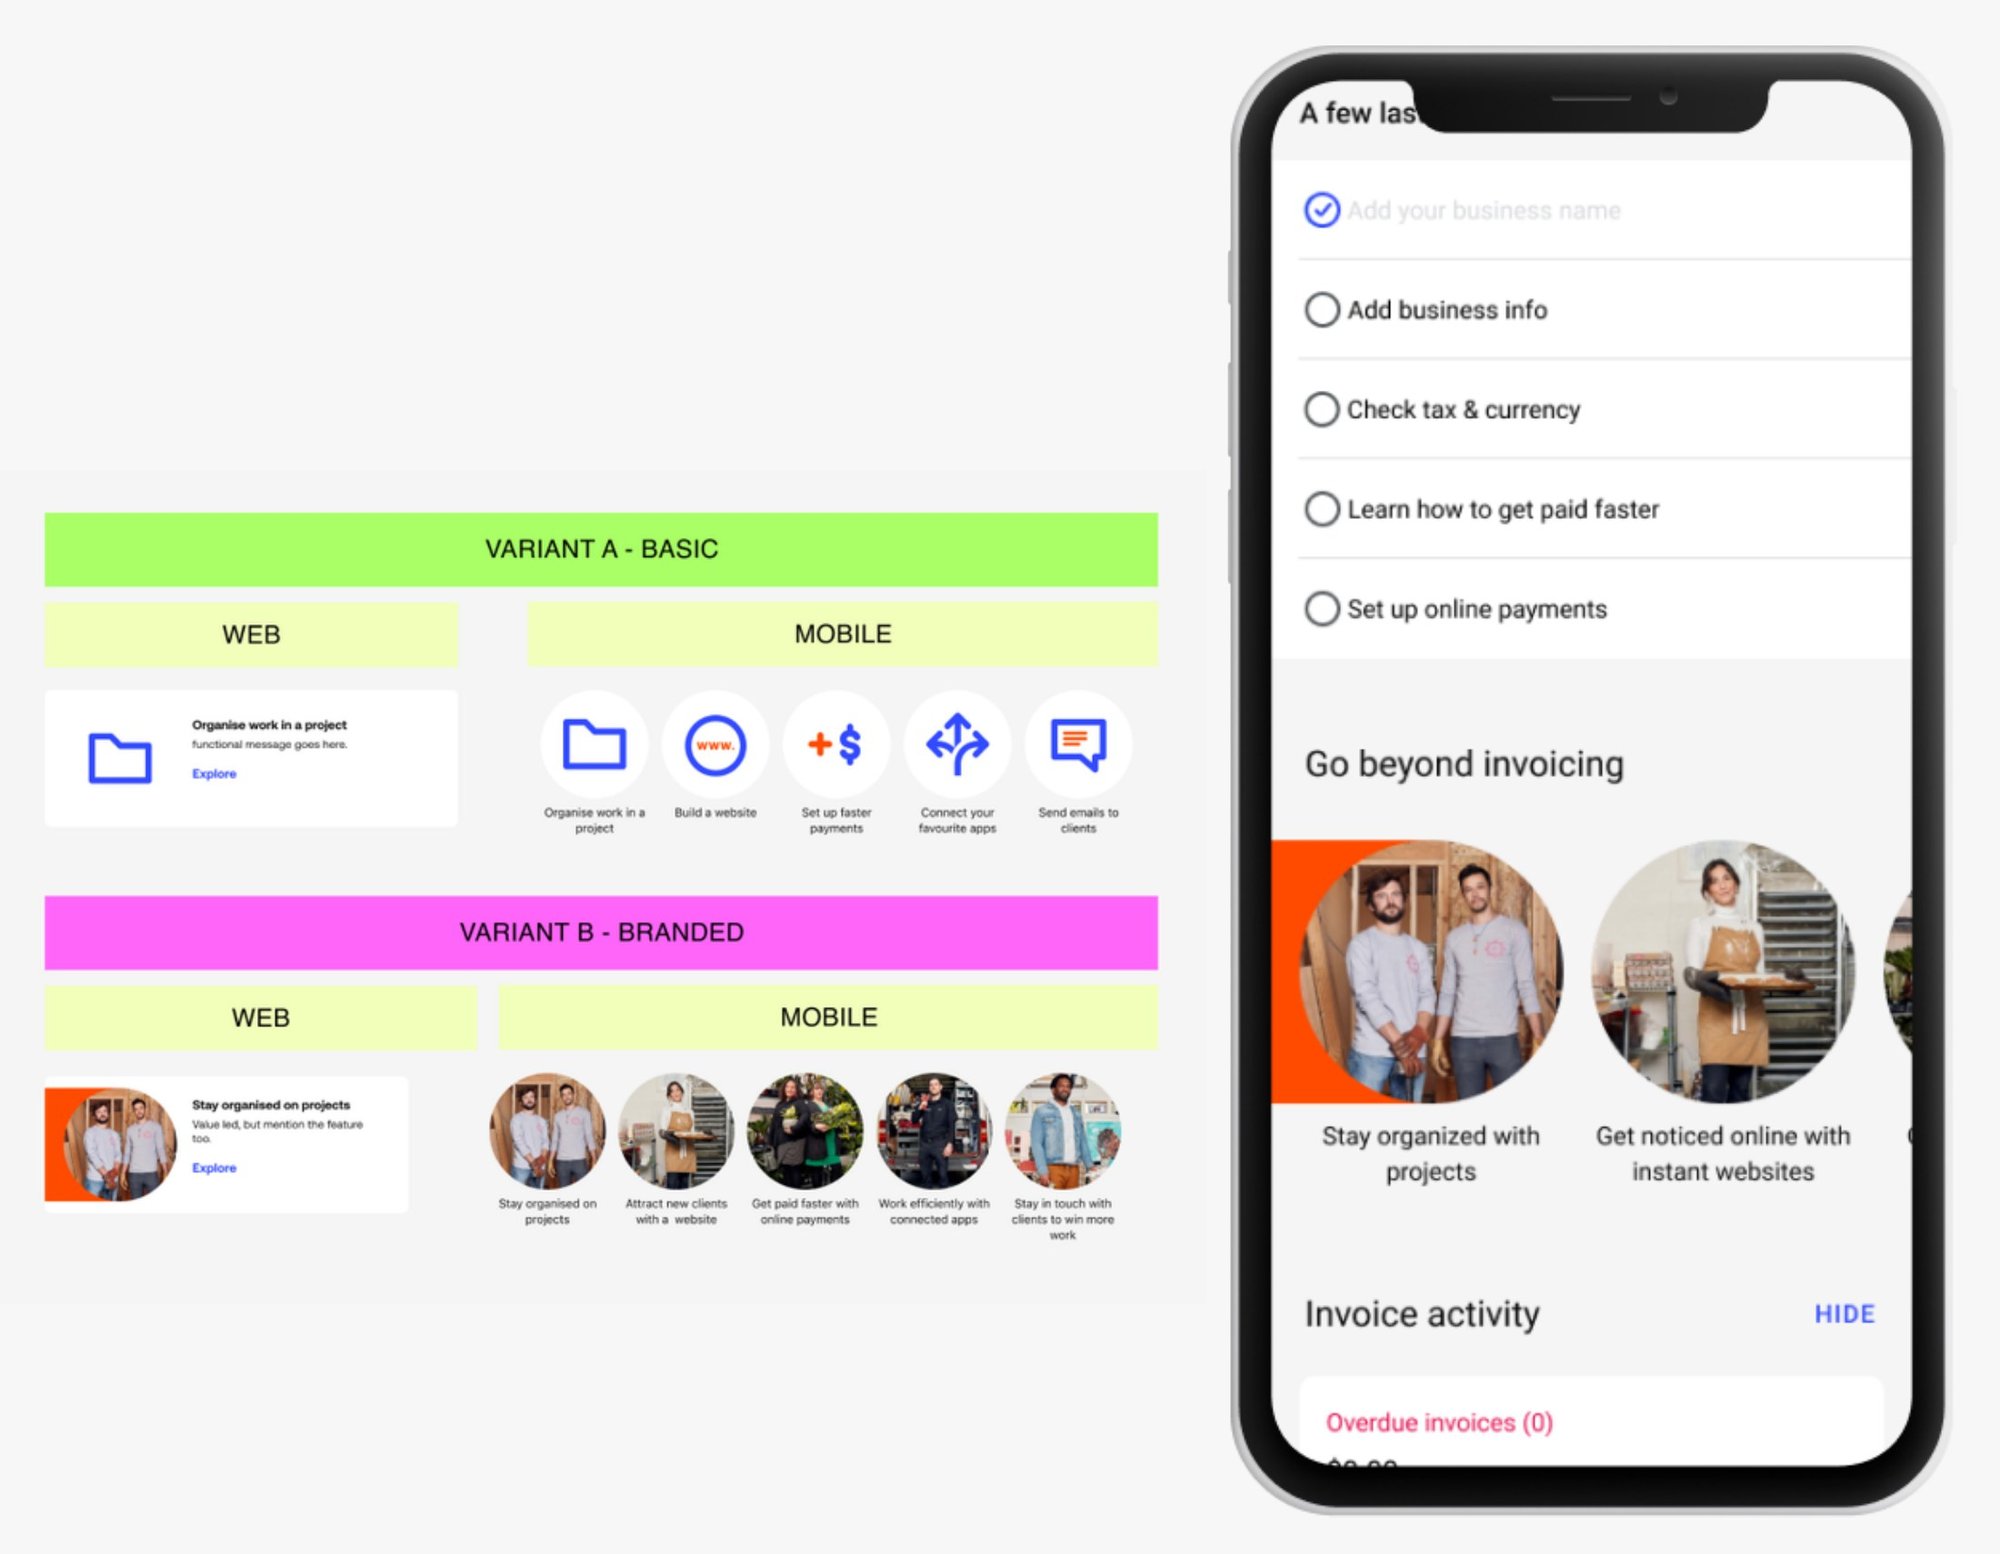
One hypothesis was that creating an invoice is a bad moment to set up payments, because it’s a long process that needs research. The test was to offer to email instructions, so people could do it at a better time. Another was whether branded imagery or a basic version of the feature-awareness cards would drive more engagement. I reused marketing imagery for the branded version, within a design system that had no new illustrations or pictograms to offer for now.
What we saw
In the first 30 days after release:
- Average conversion rose on all platforms.
- Card payments adoption increased by 9%, and the task list outperformed the Next Best Action card.
- The new sign-up pattern was reused twice elsewhere, and the Next Best Action pattern three times.
Afterwards we kept improving through data reviews, surveys and experiments, and I hired a mid-level designer to take over the project under my guidance.
What I learned
Choose leading indicators. Subscription takes weeks to show up. Customisation and payment setup moved in days, so they told us whether we were on track.
Align early across functions. Product, engineering, marketing and design each owned part of the first day. Agreeing the goal together meant fewer reversals later.
Design for handoff. The progress bar on web only worked because the engineer was in the room when we mocked up the options.
Experiment, and make each test count. It’s hard to find ex-trailists to talk to, so every test has to be a solid way of checking a hypothesis. Conversion also moves with things like pricing, so goals need a company-wide effort.
Think in journeys. The biggest gains came from connecting the steps, not polishing any one of them. I also ran weekly FullStory review sessions with the team, which spread that habit beyond me.